question id: calf-bring-pants-1
Chap 24 Exercises
\[ \newcommand{\dnorm}{\text{dnorm}} \newcommand{\pnorm}{\text{pnorm}} \newcommand{\recip}{\text{recip}} \]
Exercise 1
- Consider the function \(f(x) \equiv x^3\). Confirm that the value of the derivative \(\partial_x f(x = 0)\) and so \(x^\star = 0\) is a critical point. Which sort of critical point is \(x^\star=0\)? (Hint: Draw the graph of \(f(x)\) near \(x=0\) to see what’s going on.)
An argmax An argmin Neither
- Still working with the function \(f(x) \equiv x^3\), find the value of the second-derivative \(\partial_{xx} f(x^\star)\) evaluated at the critical point \(x = x^\star = 0\). Which of these is \(\partial_{xx} f( x=0)\)?
Negative Positive Zero
question id: calf-bring-pants-2
Exercise 2 We’d like to make a folded cardboard box in the most efficient way possible. As you know, cardboard boxes have four sides as well as eight flaps, four for the top and four for the bottom. The flaps are arranged to provide double coverage; you fold the flaps from one direction and then fold over them the flaps from the other direction.
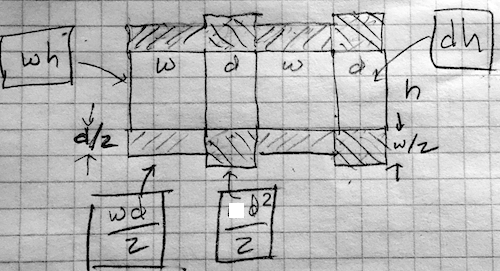 The diagram depicts the box sides and flaps laid out on a flat piece of cardboard. The flaps are shaded with diagonal lines. The formulas give the areas of various rectangles on the sheet.
Suppose the height, width, and depth of the box are \(h\), \(w\), and \(d\) respectively. The box volume is easy:
\[V = h w d\] The area of cardboard consists of the the four sides and the eight flaps. Each component’s area is a product of the two edge lengths. For example, the box sides are either \(w h\) or \(d h\). The flaps, each of which extends half-way across the bottom or top have areas \(w d/2\).
- Which of these formulas gives the area of the cardboard making up the box?
\(2 h(w + d) + 4 w d\)
\(4 h(w + d) + 2 w d\)
\(2 h(w + d) + 8 w d\)
\(4 h(w + d) + 4 w d\)
question id: duck-tell-laundry-1
A common size for a box is 1.3 cubic feet. We will use feet as the units for \(w\), \(h\), and \(d\).
- The following formulas do not describe the area of the cardboard, but they are nonetheless formulas for something. Except one of them, which cannot be true. Which one?
\(h(w + d)/d + w d^2/h\)
\(h(w + d) + w h d\)
\(h(w + d) + w^2 h/d\)
\(h(w^2/d + d) + d^2\)
question id: duck-tell-laundry-2
As \(w\), \(h\), or \(d\) are changed, the volume and surface area of the box are changed. Asking for the \(w\), \(h\), and \(d\) that minimize the surface area of the box is not a complete statement of a problem. The minimum surface area will be zero whenever two of the three dimensions have length zero. In other words, we can minimize the surface area by making a box that is no box at all!
To complete the problem statement we need something else. Here, that something is a constraint: We demand that the box have a volume of \(V = 1.3\) cubic feet.
Often, a constraint plays the role of a dimension reduction. With \(w\), \(h\), and \(d\), we have a 3-input optimization problem. But we can use the constraint equation to solve for one of the quantities as a function of the others and the (known) volume. For instance, we can find \(h\) as \[h = V/d w\]
- Plug in the above expression for \(h\) into the formula for the surface area of cardboard. Which of the following is the resulting formula in terms of \(w\), \(d\), and \(V\)?
\(2 V(w + d)/wd + 4 w d\)
\(V(w + d)/w + V(w+d)/d + 4 w d\)
\(2 w d (w + d)/V + 4 w d\)
\(2 (w + d)/wd + 4 V w d\)
question id: duck-tell-laundry-3
Active R chunk 1 contains the formula for the surface area \(A(w, d, V)\) of a box of volume \(V\). The graphics command draw a contour plot of \(A()\) as a function of \(w\) and \(d\), holding \(V = 1.3\) cubic feet.
When you draw the contour plot, you will see a broad area near the center inside the contour at area = 9.5. Towards the upper-right and lower-left corners of the plot frame are contours at higher levels of area.
- The spacing between the contours in the corners is tight, but there is no similarly spaced contour inside the region delimited by the contour at area=9.5. Why not?
We didn’t ask for contours inside 9.5.
The function shape inside the 9.5 contour is the top of a bowl, so it is pretty flat.
The function shape inside the 9.5 contour is the bottom of a bowl, so it is pretty flat.
All the points inside the 9.5 contour are at the same height.
question id: duck-tell-laundry-4
Use Active R chunk 1 to place contours at 10, 9.5, 9.4. You can do this by replacing the argument contours_at = NULL with this:
contours_at = c(10, 9.5, 9.4))Add more contours to build a fence tighter and tighter around the argmin. When the fenced region is tiny, you can read off the min from the contour label. (Remember, the “argmin” is the value of the inputs \(w\) and \(d\) at which the function is minimized. The “min” is the value of the function at the argmin.) But watch out as you do this. If you ask for a contour at a level that is lower than the min, it will simply not be drawn. Or, more precisely, there are no inputs that produce an output that is lower than the min. So you may have to change the interval between levels (e.g. 10, 9.5, 9.4, …) to home in on the argmin.
- The following are values for the output of the function where you might be able to draw a contour. Which one of the values is the smallest for which a contour appears?
9.1 9.05 9.01 9.005 9.0005 9
question id: duck-tell-laundry-5
- From your contour plot, read off the values of \(w\) and \(d\) that produce the minimum surface area for a 1.3 cubic-foot box. What are they? (Hint: You may need to zoom in on the domain to get the precision needed to answer the question.)
\(w \approx 0.9; d\approx 0.9\) \(w \approx 0.9; d\approx 0.6\) \(w \approx 0.5; d\approx 0.9\) \(w \approx 1.9; d\approx 0.9\)
question id: duck-tell-laundry-6
It is easy enough for a person to look at a contour plot and roughly locate the argmin. But this is not feasible if there are more than two inputs to the function being optimized. For such functions, another set of numerical techniques are used based on the gradient of the objective function. Remember that the gradient at any point is a vector that points in the uphill direction and whose length is proportional to the steepness of the slope. (Skiers, beware. In skiing what people call the gradient is the steepest downhill direction. This might account for all the mathematicians learning to ski who point their skis uphill in response to the ski instructor’s instruction!)
You can display the gradient on the plot of the area function by piping (remember |>) the contour plot into the commented-out command in the sandbox. (Also, replace #pipe to with |>.)
- Since the end of the term is coming, here is a question that might be a good review for the final. Which of these describes the relationship between the gradient vector and the contours?
On a contour the gradient vector is perpendicular (“orthogonal”) to the contour.
On a contour, the gradient vector has zero length.
There is no definite relationship; it depends on the function itself.
On a contour, the gradient vector has a length proportional to the contour level.
question id: duck-tell-laundry-7
- Which of these best describes the gradient vector at the argmin?
The gradient points due North.
The length of the gradient vector is maximal.
The length of the gradient vector is minimal.
The length of the gradient vector is zero.
question id: duck-tell-laundry-8
Many numerical optimization techniques are based on the idea like this: treating the field of gradient vectors as a flow field in a differential equation. Starting at some initial value, follow the gradient vectors (as you did in sketching the trajectory in a flow field). If seeking a maximum, the flow will be in the direction of the gradient. If seeking a minimum, the flow will be opposite the direction of the gradient. It is not necessary to calculate the gradient everywhere; you just have to calculate it at the present point on your trajectory to know which way to go next.
Occasionally, particularly in textbook problems, the argmin or argmax is found algebraically. This still involves calculating the gradient as a function of the inputs. Then, find the inputs that make all the components of the gradient vector zero.
- Which of these formulas give the gradient vector of \(A(w, d)\)?
\(\partial_w A = -2 \frac{V}{w^2}+ 4 d, \ \ \partial_d A = -2 \frac{V}{d^2} - 4 w\)
\(\partial_w A = -2 \frac{V}{d^2}+ 4 d, \ \ \partial_d A = -2 \frac{V}{w^2} - 4 w\)
\(\partial_w A = -2 \frac{V}{w^2}+ 4 w, \ \ \partial_d A = -2 \frac{V}{d^2} - 4 d\)
\(\partial_w A = -2 \frac{V}{d w}+ 4 w, \ \ \partial_d A = -2 \frac{V}{d w} - 4 d\)
question id: duck-tell-laundry-9
- If the lengths \(w\), \(d\), \(h\) are measured in feet, what unit will \(\partial_w A\) be in?
feet square feet cubic feet 1/feet dimensionless
question id: duck-tell-laundry-10
For those of you who are pining for algebra problems, here you go.
Taking the gradient of \(A(w, d)\) (given in a previous question), set both components to zero, giving you two equations in the two variables \(w\) and \(d\). There is also a \(V\) in the equations, but we’ve set up the problem saying that we already know \(V\). Numerically, we used \(V=1.3\) cubic-feet, but in the algebra solution we can just leave \(V\) as a symbol, giving general formulas for \(w\) and for \(d\) in terms of \(V\).
- Which of these is the correct formula for the optimal \(w^\star\) as a function of \(V\)? (Hint: You can weed out one of the choices by checking for dimensional consistency.)
\(w^\star = \frac{\sqrt[3]{V}}{\sqrt[3]{2}}\)
\(w^\star = \frac{\sqrt[3]{V}}{\sqrt[3]{3}}\)
\(w^\star = \frac{\sqrt[2]{V}}{\sqrt[2]{3}}\)
question id: duck-tell-laundry-11
The solution for \(d^\star\) is the same as for \(w^\star\). (An experienced algebraist would have noticed that in the formula for area, you can swap inputs \(w\) and \(d\) without changing the output.)
Now compute the formula for the optimal value \(h^\star\). (Hint: Early in the section we gave a formula that involves \(V\), \(h\), \(w\), and \(d\).)
- Which of these is the correct formula for the optimal \(h^\star\) as a function of \(V\)?
\(h^\star = 2^{2/3} \sqrt[3]{V}\)
\(h^\star = 2^{1/3} \sqrt[3]{V}\)
\(h^\star = 3^{2/3} \sqrt[3]{V}\)
\(h^\star = 3^{1/3} \sqrt[3]{V}\)
question id: duck-tell-laundry-12
It turns out that \(h^\star\) is somewhat larger than either \(w^\star\) or \(d^\star\); the optimal box has a square top and bottom, but the sides are not square.
- Which of these is an appropriate explanation for why \(h^\star\) is larger than \(w^\star\) or \(d^\star\)?
People don’t like using boxes that are perfect cubes.
\(h\) multiplies both \(w\) and \(d\), but not vice versa, in the formula for surface area.
The flaps need to get longer as \(h\) gets longer, so smaller \(h\) helps to minimize the amount of cardboard.
The flap-length does not depend on \(h\), only on \(w d\). So we can make \(h\) larger without contributing to the “wasted” area of the doubling over of flaps. The flaps get smaller as \(wd\) gets smaller, so larger \(h\) is preferred.
question id: duck-tell-laundry-13
Exercise 3 You and your pet dog Swimmer often go to the beach and walk along the water’s edge. You throw a ball down the beach, but at an angle so it lands in the water. Swimmer goes to work. She runs down the beach (fast) and then plunges into the water, heading toward the ball. She can run fast on the beach: 400 m/minute. But she swims rather slower: 50 m/min.
Suppose you threw the ball to a point about 50 meters down the beach and 10 meters out in the water. The overall distance to the ball is therefore \(\sqrt{50^2 + 10^2} \approx 51\) meters. If Swimmer entered the water immediately, she would take about a minute to reach the ball (51 m / 50 m/min). Swimmer can get to the ball faster by running down the beach a bit and then turning into the water. If Swimmer ran all 50 meters down the beach and then turned to swim the 10 meters, it would take her (50/400 + 10/50) minutes, about one-third of a minute.
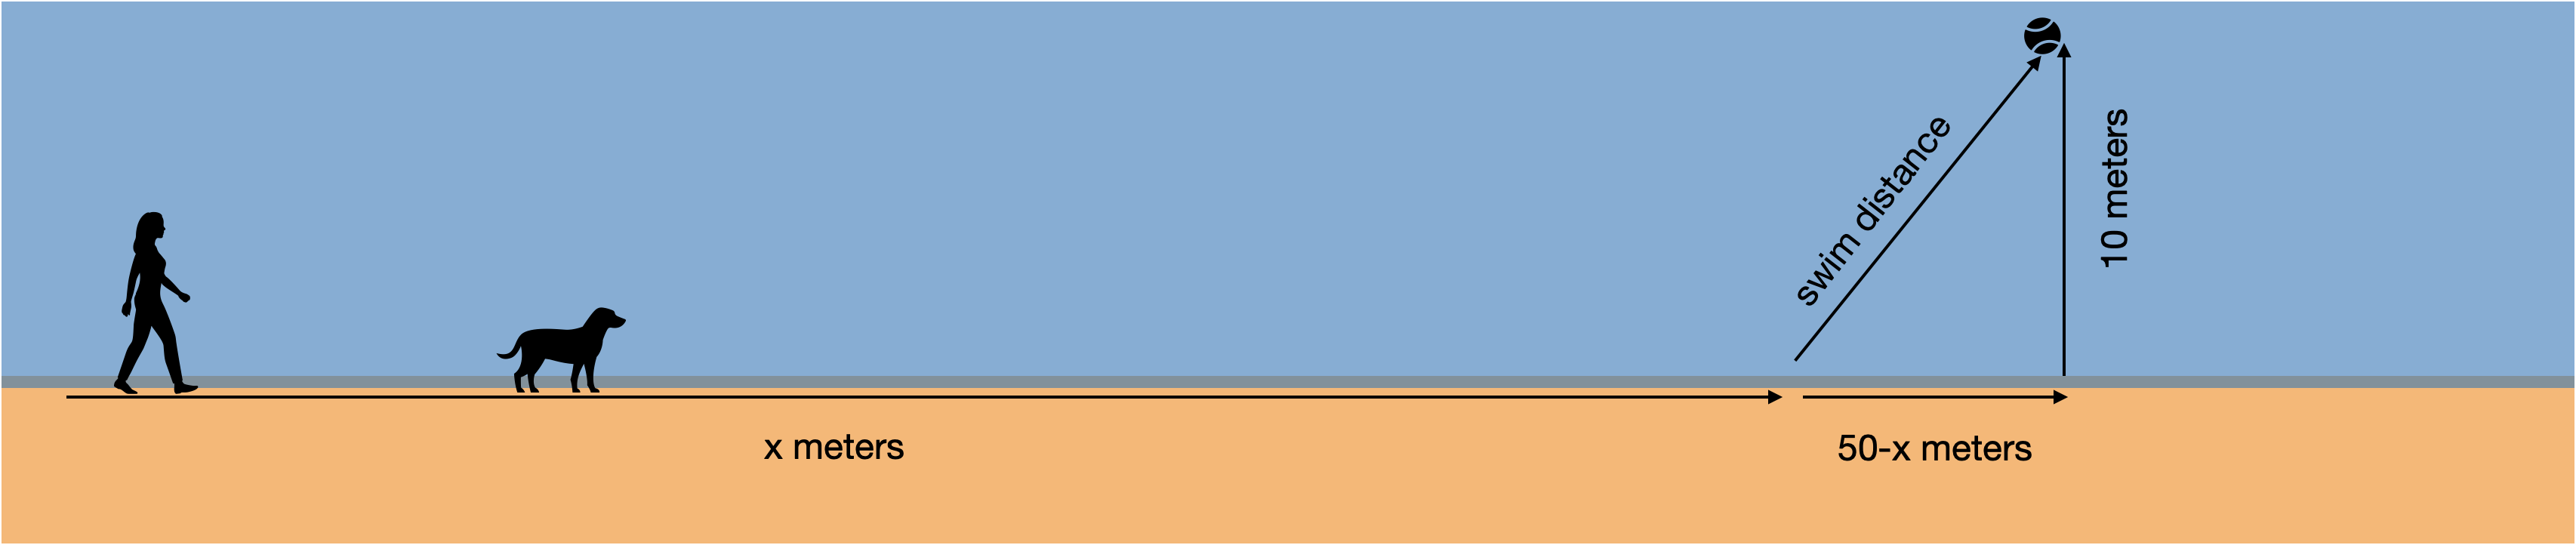
Can Swimmer do better? You can set up the calculation like this. Imagine \(x\) to be the distance down the beach that Swimmer runs. The time to run this distance will be \(x/400\). The distance remaining to the ball can be found by the Pythagorean theorem. One leg of the triangle has length \((50-x)\), the other has length 10 m. So, the length of the third side is \(\sqrt{\strut (50-x)^2 + 10^2}\). For instance, if \(x\) were 45, the distance to swim in the water would be \(\sqrt{(50-45)^2 + 10^2} = 11.2\) m. Divide this distance by 50 m/min to get the time spent in the water.
Time_to_ball() takes one argument, the distance \(x\) Swimmer runs down the beach before turning into the water. Complete and use Active R chunk 2 to find the distance that calculus-savvy Swimmer runs down the beach before turning into the water, if Swimmer’s goal is to get to the ball as fast as possible.
What’s the optimal running distance for Swimmer?
46.75 47.5 48.75 49.75
question id: optim-violet-1
Here’s a news story about a mathematician’s dog on the shore of Lake Michigan. It is not plausible that Swimmer has been trained in calculus. Perhaps the way Swimmer solves the running distance problem is simply to graph time_to_ball(x) ~ x over a suitable domain and find the argmax by eye!
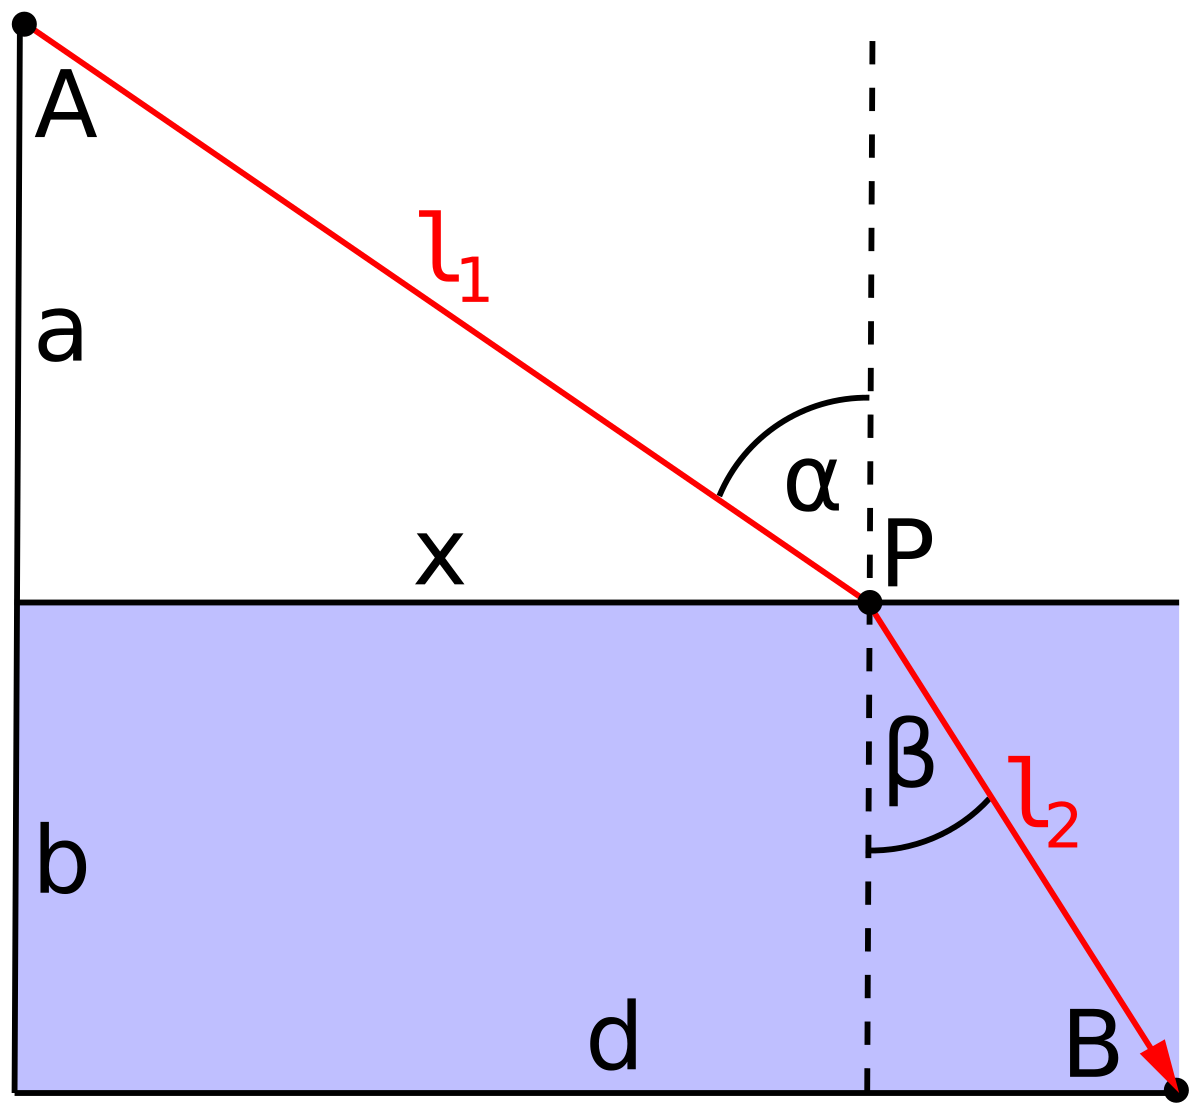
Exercise 4 If you’re skeptical that a dog might do a calculus problem (as in Exercise 3) before running to fetch a ball, consider the path taken by a photon. “Fermat’s Principle” is that light takes the path of least time. To illustrate, consider the problem of a photon traveling from a point A to a point B, as in the diagram. The shortest path between the two points is a straight line. Along this straight-line path, the time taken by the photon will be the distance divided by the speed of light.
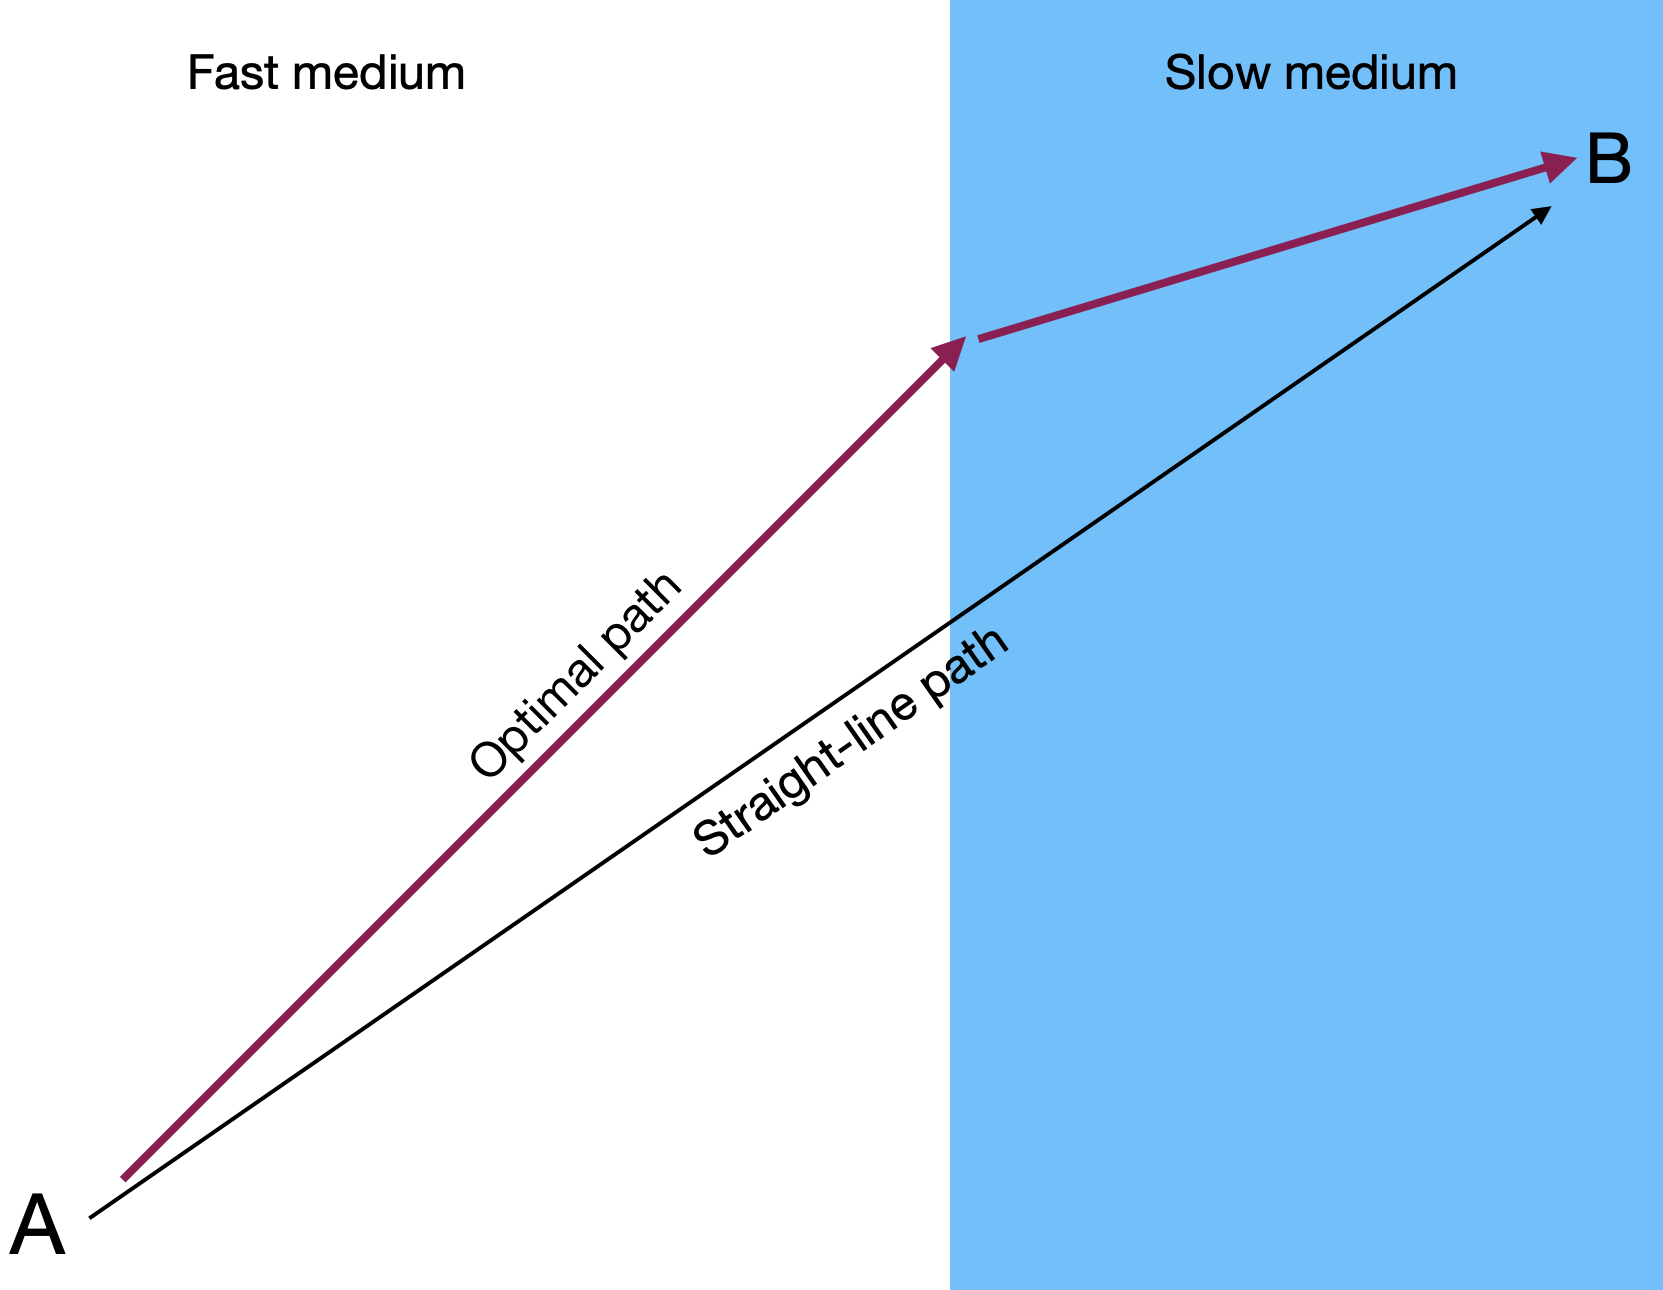
The diagram shows another path consisting of two segments, one of length \(l_1\) and the other \(l_2\). Obviously, the two-segment path is longer than the straight-line path. But according to Fermat’s principle, light “prefers” the longer path if the time taken to traverse it is shorter. This phenomenon is called refraction.
The reason the indirect path might be shorter is that the speed of light differs in different physical media. Light traveling in a vacuum famously has a speed of about 300,000 km per second. In air, the speed is smaller by a factor of 1/1.003. In water, the speed is smaller still: the factor is 1/1.3.
Imagine that the blue zone of the diagram is water and the clear zone air. The time for the photon to travel from point A to B is proportional to \(1.003\ l_1 + 1.3\ l_2\).
To see the path taken by light, let’s imagine that point A is \((x=0, y=10)\) and point B is \((x=20, y=-10)\), and that the boundary between water and air is at \(y=0\). We will place the point P at \((x, 0)\). The total time taken for light to traverse this path is 1.003 dist(A to P) + 1.3 dist(P to B).
- Which of these formulas gives the total time it takes for light to traverse the path from A to P at relative speed 1/1.003 and then the path from P to B at relative speed 1/1.3? A is located at \((0, 10)\), B is located at \((20,-10)\), and P is located at \((x, 0)\)
\(1.003 \sqrt{(x-0)^2 +(0-10)^2}+ 1.3\sqrt{(20-x)^2 + (-10 - 0)^2}\)
\(\sqrt{(x-0)^2 +(0-10)^2}/1.003+ \sqrt{(20-x)^2 + (-10 - 0)^2}/1.3\)
\(1.003 \sqrt{(x-10)^2 +(0-0)^2}+ 1.3\sqrt{(-10 -x)^2 + (50 - 0)^2}\)
question id: optim-pink-1
Implement the calculation of total_time() in Active R chunk 3, then use a graph to find the argmin.
- What value of \(x\) (that is, the argmin) minimizes the travel time of light between points A and B? (Choose the best answer from the slice plot you made in Active R chunk 3)
10.52 11.02 12.22 12.50 13.21 14.94
question id: optim-pink-2
- Suppose that instead of being water, the blue area was glass. The speed of light in glass is roughly 1/1.5 times as big as in vacuum. What value of \(x\) minimizes the travel time of light between points A and B? (Choose the best answer)
13.60 14.58 14.85 15.54
question id: optim-pink-3
- At the argmin for \(x\) in the travel time, what will be the derivative of travel time with respect to \(x\)?
Positive Zero Negative
question id: optim-pink-4
- At the argmin for \(x\) in the travel time, what will be the second derivative of travel time with respect to \(x\)?
Positive Zero Negative
question id: optim-pink-5
Exercise 5
The graphic drawn by Active R chunk 4 shows a lens together with a source and target point. Functions are used to define the top and bottom surface of the lens. Light passing through the lens is refracted. The path followed by the light will be the one with the shortest time of transit from source to target. But Active R chunk 4 initially is set up to trace a non-optimal, out-of-the-way path running through \(x_{in}=10\) on the bottom to \(x_{out}=5\) on the top.
Note: The plot_lens() function has been provided for you, but it’s too computer-ese to bother showing you with how it’s defined.
The light enters the lens at some point \(P_{in} = (x_{in}\ , \ -\text{Lens}(x_{in}))\) and leaves at \(P_{out} = (x_{out}\ ,\ \text{Lens}(x_{out}))\). We don’t know either \(x_{in}\) or \(x_{out}\). but we can find them by optimization.
To do this, we find the distance from the source to \(P_{in}\), and from \(P_{out}\) to the target. These two legs of the route are through air, so the time of transit on each leg is proportional to the refractive index 1.03 times the distance.
Of course, light also has to travel through the lens. We will make the lens out of glass with a high refractive index, so the transit time will be the distance from \(P_{in}\) to \(P_{out}\) multiplied by the lens’s refractive index, which we’ll set to be 1.8.
The objective function will be the sum of the three legs’ transit times. It is already programmed for you in the sandbox. So is the command to make a contour plot of the output of the objective function over a domain of \(x_{in}\) and \(x_{out}\). Finally, the last line in ?lst-optim-purpose draws a picture of the lens and the light path, but you will have to insert the argmins \(x_{in}\) and \(x_{out}\) that you pick from the contour plot of the objective function. (The \(x_{in}\) and \(x_{out}\) shown in the initial code of Active R chunk 5 are not right!)
- When the index of refraction of the lens is 1.80, what are the optimal values for \(x_{in}\) and \(x_{out}\)? (Choose the closest answer.)
\(x_{in} = -22, \ x_{out} = -21\)
\(x_{in} = -26, \ x_{out} = -20\)
\(x_{in} = -24, \ x_{out} = -21\)
\(x_{in} = -18, \ x_{out} = -17\)
\(x_{in} = -25, \ x_{out} = -20\)
question id: optim-purple-1
It is a good practice to test software against situations where you know the right answer. A simple situation is when there is no lens at all. One way to do this is to change the middle line of transit_time() so that the index of refraction is 1.03, just like the surrounding air.
- When the index of refraction of the lens is 1.03, what are the optimal values for \(x_{in}\) and \(x_{out}\)? (Choose the best answer.)
\(x_{in} = -17, \ x_{out} = -15\)
\(x_{in} = -18, \ x_{out} = -14\)
\(x_{in} = -16, \ x_{out} = -16\)
\(x_{in} = -18, \ x_{out} = -18\)
\(x_{in} = -17, \ x_{out} = -18\)
question id: optim-purple-2
Let’s explore an extreme situation. Diamond is the transparent material that has the highest index of refraction, 2.417. Imagine a material with an index of refraction of 10. This means that light will travel very slowly within the lens.
When you examine the contour plot of transit_time() for this high index of refraction, there will be two, widely separated local minima. Explain briefly which part of the lens these two minima correspond to. Hint: High index means slow speed of light. Sometimes it is worthwhile to go out of your way to avoid slowdowns.
Exercise 6 Your uncle Bob is writing a business plan for a tree farm for lumber. Having heard that you are taking Math 141Z, he emails you giving some information asking for some numbers. In particular, Bob sends you a report saying that, for the species of tree he plans to plant, the amount of usable lumber is a function of growth time \(t\) looking like the function lumber():
Bob has heard that the time to harvest is when the tree is growing fastest.
- What is the value of
t(in years) at which \(\partial_t\)lumber(t)is largest?
15 16 17 18 19 20 21 22 23 24 25 26 27 28 29 30
question id: optim-green-A
You patiently explain to your uncle that you certainly do not want to harvest trees when they are growing the fastest. You say, “You want to wait until the average growth rate up to that point is fastest. That will be a little while before the tree reaches its adult volume.”
In Active R chunk 7, give the expression for the average growth rate function in terms of lumber() and t. Keep in mind the starting point is 0 lumber at time 0.
- What is the value of t (in years) for which the average growth rate, up to that time, is fastest.
15 17 19 21 23 25 27 29 31 33 35 37 39 41
question id: optim-green-B
Exercise 7 It often happens in decision making that there are multiple criteria. For instance, in selecting cadets for pilot training, two obvious criteria are the cadet’s demonstrated flying aptitude and the leadership potential of the cadet. Let’s assume that the merit \(M\) of a candidate is a function of flying aptitude \(F\) and leadership potential \(L\).
Currently, the merit score is a simple function of the \(F\) and \(L\) scores: \[M_{current}(F, L) \equiv F + L\]
The general in charge of the training program is not satisfied with the current merit function. “I’m getting too many cadets who are great leaders but poor pilots, and too many pilot hot-shots who are poor leaders. I would rather have an good pilot who is a good leader than have a great pilot who is a poor leader or a poor pilot who is a great leader.” (You might reasonably agree or disagree with this point of view, but the general is in charge.)
You’ve been tasked to develop an improved formula for the merit score \(M_{improved}(F, L)\).
A low-order polynomial model, without quadratic terms, is \[M(F, L) = d_0 + d_1 F + d_2 L + d_{12} F L .\]
You are trying to decide whether \(d_{12}\) should be positive, negative, or zero. To guide your decision, you have only this statement from the general in charge of the program: ”
Take a few minutes now to think about how you would decide whether \(d_{12}\) should be positive or negative or zero to implement the general’s view. The rest of the problem will guide you to a solution, but you will understand better if you try on your own, first.
Using the low-order polynomial model, find algebraically these two partial derivatives
- \(\partial_F M(F, L)\) and
- \(\partial_L M(F, L)\)
- Which of these possibilities is true about \(\partial_F M\) as a function of \(F\)?
Increases with F Decreases with F Is not a function of F.
question id: rooster-red-1
- Which of these possibilities is true about \(\partial_L M\) as a function of \(L\)?
Increasing Decreasing Is not a function of L.
question id: rooster-red-2
- Which one of these describes the relationship between \(\partial_F M()\) as a function of \(L\) and \(\partial_L M()\) as a function of \(F\)? (Hint: Remember that \(d_1\) and \(d_2\) are specified as being positive.)
If \(\partial_F M()\) is an increasing function of \(L\), then \(\partial_L M()\) must be a decreasing function of \(F\).
If \(\partial_F M()\) is an increasing function of \(L\), then \(\partial_L M()\) must be an increasing function of \(F\).
Neither of the above needs to be true.
question id: rooster-red-3
Think now about the general’s statement and how to translate it into mathematical terms. Here’s a hint: Imagine Drew has very high \(F\) score and low \(L\) score. Consider another cadet, Blake, with scores \(F-\epsilon\) and \(L + \epsilon\). Blake’s flying and leadership scores are closer together than Drew’s. Both Drew and Blake have the same average of \(F\) and \(L\). But would the general find Blake superior or inferior to Drew? If superior, then you would want \(\partial_L M > \partial_F M\). If inferior, then your model should have \(\partial_L M < \partial_F M\). If the general would be indifferent between Drew and Blake, then the two partial derivatives should be equal.
- Based on the general’s statement, do you want \(d_{12}\) to be positive, negative, or zero?
Positive
Zero
Negative
It has nothing to do with the general’s statement.
question id: rooster-red-4
Exercise 8 Based on an extensive but fictive observation of activity and grades of college students, the model shown in Figure 4 was constructed to give GPA as a function of the number of hours each weekday (Monday-Friday) spent studying and spent in social activity and play. (Activity during the weekend was not monitored.)
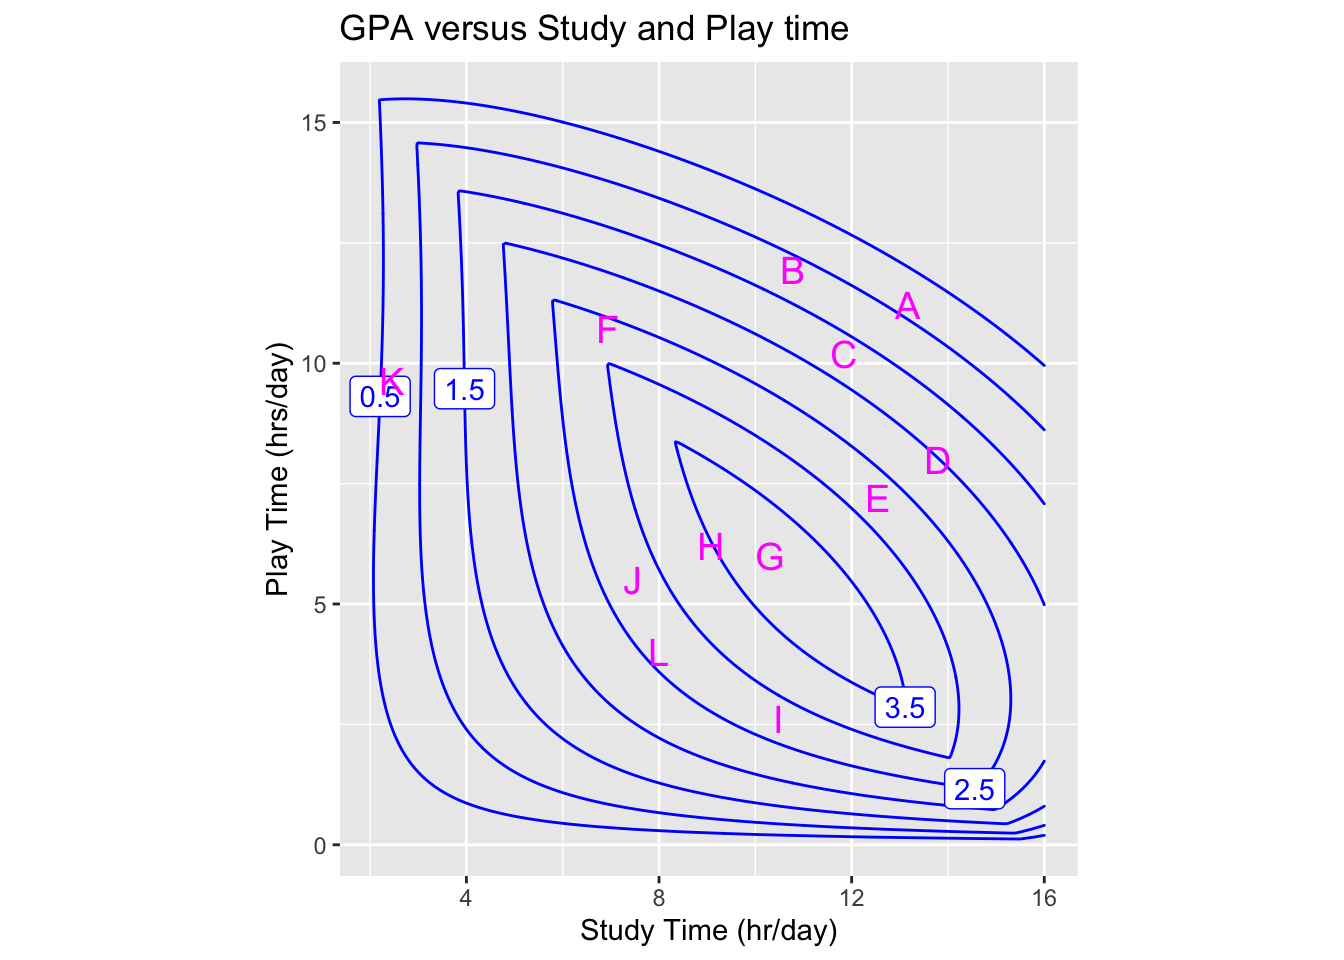
Several points in the graphic frame have been marked with letters. Refer to these letters when answering the following questions.
- According to the model, what’s the optimal combination of Study and Play to achieve a high GPA?
F G H I
question id: sh1-1
- Which of these letters marks a place on the graph where the partial derivative of GPA with respect to Play is positive?
B C K L
question id: sh1-2
- Which if these ketters marks a place on the graph where the partial derivative of GPA with respect to Play is negative.
A J L K
question id: sh1-3
- Where is the partial derivative with respect to Study is negative?
Nowhere. \(\partial_{study} GPA()\) is always positive. More study = better grades. K A D
question id: sh1-4
Study and Play are not the only activities possible. Sleep is important, too, as are meals, personal care, etc. In the study, students were observed who spent up to 22 hours per day in Study or Play. Presumably, such students crashed on the weekend.
- Suppose you decide to budget 12 hours each weekday day in activities other than Study and Play. Which letter labels the constrained optimal mix (argmax) of Study and Play.
I J F L
question id: sh1-5
- What is the “shadow price” of GPA with respect to the budget for a budget constraint of 12 hours? Give both an estimated numerical value as well as units.
-0.8 hour/gradepoints
0.3 gradepoints/hour
0.9 gradepoints/hour
1.3 hour/gradepoints
question id: sh1-6
- Consider a student who budgets 22 hours per day for Study and Play. Which letter is closest to the constrained argmax with a 22-hour constraint?
A B C D
question id: sh1-7
- What is the “shadow price” of GPA with respect to the budget constraint of 22 hours? Give the estimated numerical value.
-0.4 gradepoints/hour
0 gradepoints/hour
0.4 gradepoints/hour
1.0 gradepoints/hour
question id: sh1-8
- Based on the shadow price from the previous question, which of these is the best advice to give the student (who seeks to maximize GPA)?
You’re hopeless. There aren’t enough hours in the day for you to get a good GPA.
You’ve got to squeeze out more effort studying. Give it your all!
Play more, study less!
Study less
Study less, play less. Sleep!
question id: sh1-9
Exercise 9 Consider the problem faced by a propane distribution company manager: find the optimal radius of a cylindrical tank with spherical ends. The point is to choose the sphere radius \(r\) and the cylinder length \(h\) that minimize the surface area of the tank while enclosing a specified volume. In terms of \(h\) and \(r\), the volume and surface area are:
\[V(r, h) = \pi r^2 h + \frac{4}{3} \pi r^3 \ \ \ \text{and}\ \ \ A(r,h) = 2 \pi r h + 4 \pi r^2\]
- Which of these is correct? (Hint: Only one of the answers is dimensionally consistent.)
\(h(r, V) = (V-4\pi r^3/3)/ \pi r^2\)
\(h(r, V) = (V-4\pi r^2/2)/ \pi r^2\)
\(h(r, V) = (V-4\pi r^3/3)/ \pi r^3\)
\(h(r, V) = \sqrt{(V-4\pi r^3/2)/\pi r^3}\)
question id: tb1-1
- Which of these is the correct expression for \(A(r, V)\)
\(A(r, V) = 2 V/r + \frac{8 \pi}{3} r^2\)
\(A(r, V) = 2 V/r + \frac{4 \pi}{3} r^2\)
\(A(r, V) = V/r + \frac{20 \pi}{3} r^2\)
\(A(r, V) = V/r + 3 \pi r^2\)
question id: tb1-2
- Find \(\partial_r A(r, V)\) and set to zero. Solve for \(r^\star\) in terms of \(V\). Which of these is correct?
\(r^\star = \sqrt[3]{\frac{3}{4\pi} V}\)
\(r^\star = \sqrt[3]{\frac{4}{3\pi} V}\)
\(r^\star = \sqrt[3]{\frac{3\pi}{4} V}\)
\(r^\star = \sqrt[3]{\frac{3}{2\pi} V}\)
question id: tb1-3
- What is the optimal value of \(r\) in cm to a precision of one micron?
6.2035 46.0351 52.0351 62.0351
question id: tb1-4
- Find the optimum value of \(r\) to minimize \(A(r,V)\) when \(V = 1000\) liters.
6.2035 46.0351 52.0351 62.0351
question id: tb1-5
Use Active R chunk 8 to plot a graph of \(A(r, V)\) versus r, setting \(V = 1000\) liters.
- From the graph of \(A(r, V)\) versus \(r\) at \(V=1000\) liters, read off a range of \(r\) that produces \(A\) no worse than 1% greater than the minimum. How wide is that range, approximately?
\(\pm 0.1\)cm \(\pm 1\)cm \(\pm 5\)cm \(\pm 10\)cm
question id: tb1-6
Activities
Exercise 10 The key steps in optimization are setting up the objective function(s) and setting constraints as needed to represent the problem at hand. There are many ways to perform the work to extract the argmax once the objective function and constraints are set.
Understandably, calculus textbooks tend to emphasize techniques based on finding an input where the derivative of the objective function is zero. For problems involving multiple inputs, the task is to find an input where the gradient vector is zero.
Contemporary work often involves problems with tens, hundreds, thousands, or even millions of inputs. Even in such large problems, the mechanics of finding the corresponding gradient vector are straightforward. Searching through a high-dimensional space, however, is not generally a task that can be accomplished using calculus tools. Instead, starting in the 1940s, great creativity has been applied to develop algorithms with names like linear programming, quadratic programming, dynamic programming, etc. many of which are based on ideas from linear algebra such as the qr.solve() algorithm for solving the target problem, or ideas from statistics and statistical physics that incorporate randomness as an essential component. An entire field, operations research, focuses on setting up and solving such problems. Building appropriate algorithms requires deep understanding of several areas of mathematics. But using the methods is mainly a matter of knowing how to set up the problem and communicate the objective function, constraints, etc. to a computer.
Purely as an example, let’s examine the operation of an early algorithmic optimization method: Nelder-Mead, dating from the mid-1960s. (There are better, faster methods now, but they are harder to understand.)
Nelder-Mead is designed to search for maxima of objective functions with \(n\) inputs. The video shows an example with \(n=2\) in the domain of a contour plot of the objective function. Of course, you can simply scan the contour plot by eye to find the maxima and minima. The point here is to demonstrate the Nelder-Mead algorithm.
Start by selecting \(n+1\) points on the domain that are not colinear. When \(n=2\), the \(2+1\) points are the vertices of a triangle. The set of points defines a simplex, which you can think of as a region of the domain that can be fenced off by connecting the vertices.
Evaluate the objective function at the vertices of the simplex. One of the vertices will have the lowest score for the output of the objective. From that vertex, project a line through the midpoint of the fence segment defined by the other \(n\) vertices. In the video, this is drawn using dashes. Then try a handful of points along that line, indicated by the colored dots in the video. One of these will have a higher score for the objective function than the vertex used to define the line. Replace that vertex with the new, higher-scoring point. Now you have another simplex and can repeat the process. The actual algorithm has additional rules to handle special cases, but the gist of the algorithm is simple.
Exercise 11 When we locate an argmax, it’s helpful to have some guidance about how much precision make practical sense. We can figure this out using the second derivative of the function at the argmax.
Consider a function f(x) and its curvature at an argmax. The curvature is the reciprocal of the radius of a circle tangent to the function. That circle approximates the function itself. At an argmax, the highest point in the circle will be right on the function. But a few degrees to either side of the highest point will be very close to the highest point. How wide will the chord of the circle be that connects the points 5 degrees to either side of the highest point? Your answer will involve sin() but also the curvature of the function.
No answers yet collected