The set of all possible values for the input.
The value of the input.
The typographical area between the open and close parentheses that follow a function name.
question id: 04-input-space
\[ \newcommand{\dnorm}{\text{dnorm}} \newcommand{\pnorm}{\text{pnorm}} \newcommand{\recip}{\text{recip}} \]
Reading question 4.1 What do we mean by the “input space” to a function (with a single input)?
The set of all possible values for the input.
The value of the input.
The typographical area between the open and close parentheses that follow a function name.
question id: 04-input-space
Reading question 4.2
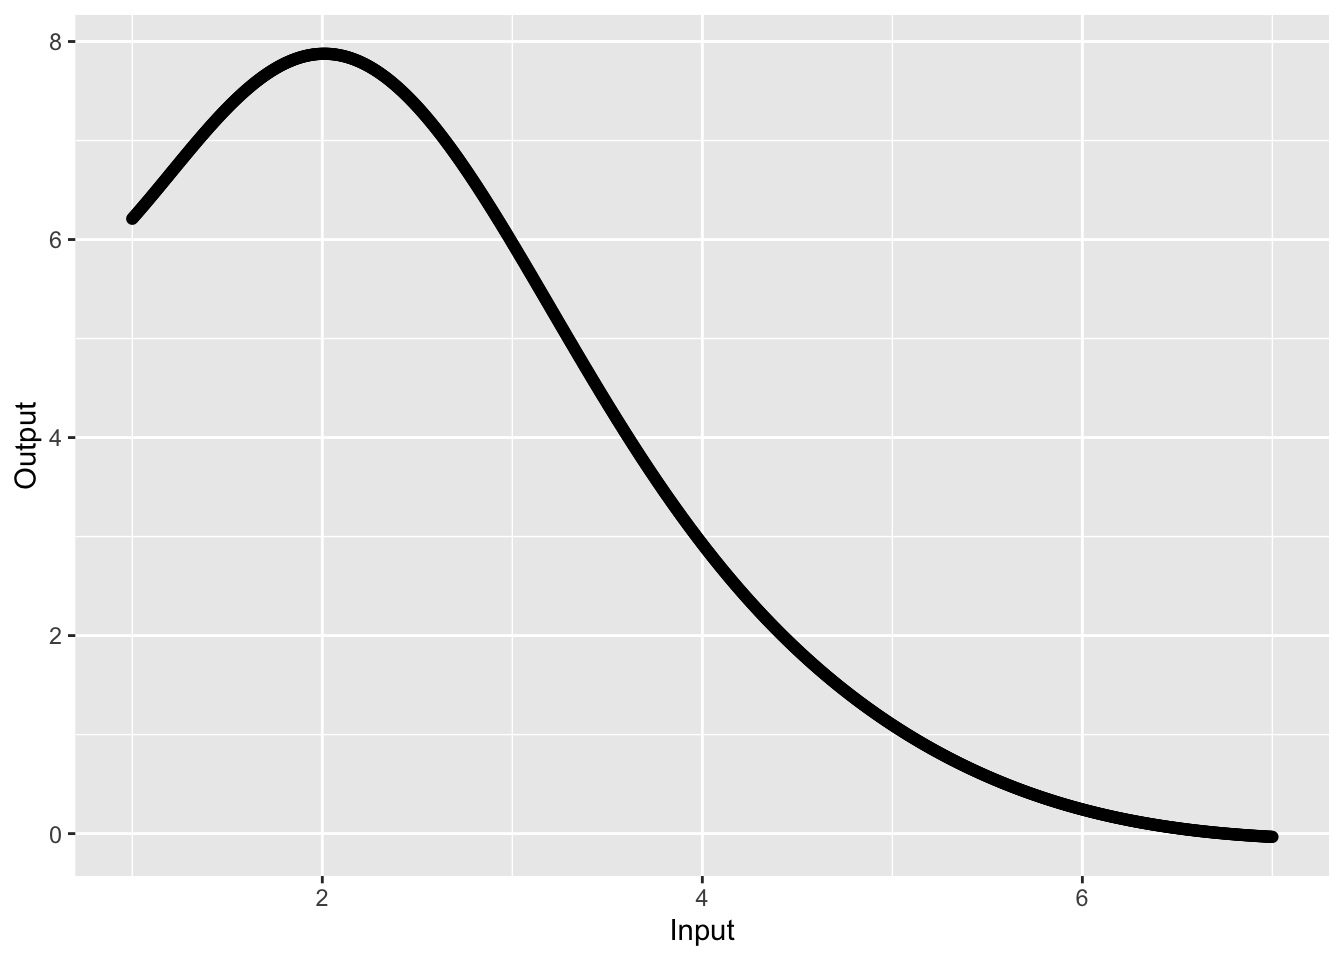
question id: 04-show-graph-a
0 to 8
2 to 6
1 to 7
none of these
question id: 04-show-graph-b
0 to 8
1 to 7
\(-\infty\) to \(\infty\)
0 to \(\infty\)
Can’t be determined from the graph.
question id: 04-show-graph-c
Reading question 4.3 Which axis represents the output in a function graph (like Figure fig-04-show-graph)?
question id: 04-graph-axis
Reading question 4.4 Which axis represents the output in a contour plot?
question id: 04-contour-axis
Reading question 4.5 What does domain() accomplish in drawing graphs with slice_plot() or contour_plot()?
It sets the domain of the function being graphed.
It sets the graphic domain, that is the region of input space shown in the graphic.
It isn’t used with slice_plot() or contour_plot().
question id: 04-domain-does
Reading question 4.6 What arguments does domain() take?
The name(s) of the function output(s)
The name(s) of the function input(s)
Either x or y or both, depending on how many inputs the function has.
question id: 04-domain-args
Reading question 4.7 In a contour plot, domain() takes two arguments. Why?
Reading question 4.8
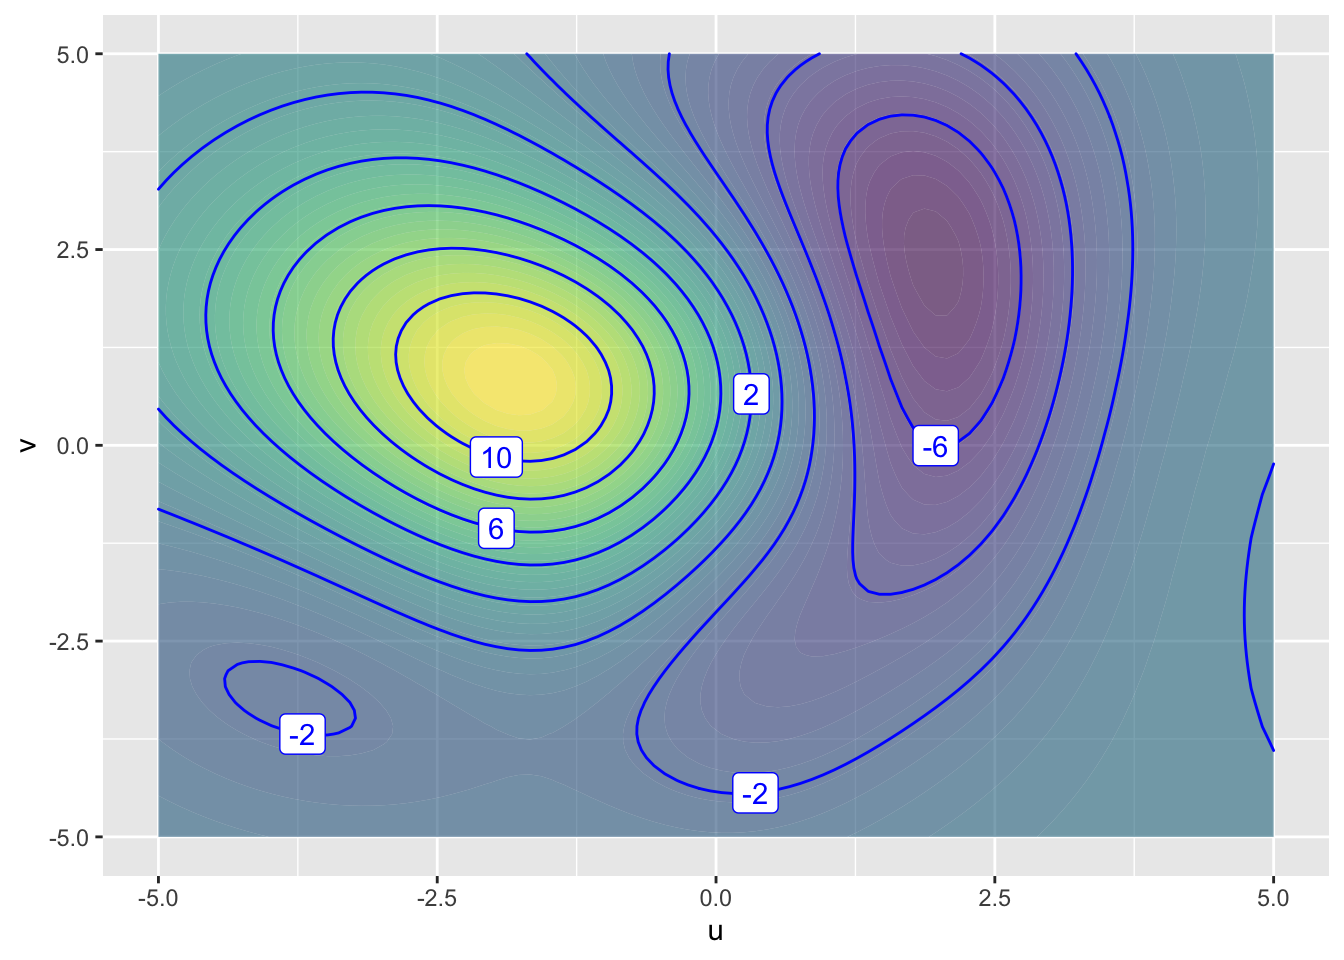
domain() used in Figure fig-04-colors?
domain(x = 0:5, y = 0:5)
domain(u = 0:5, v = 0:5)
domain(x = -5:5, y = -5:5)
domain(u = -5:5, v = -5:5)
question id: 04-colors-b