domain(x=c(-5, 5), y=c(-5, 5)
domain(x=c(1, 5), y=c(1, 5)
domain(x=c(1,1), y=c(-1,1)))
domain(x=c(5,10), y=c(0,10)))
question id: drl-1
\[ \newcommand{\dnorm}{\text{dnorm}} \newcommand{\pnorm}{\text{pnorm}} \newcommand{\recip}{\text{recip}} \]
Exercise 1 Use the function named \(\text{twins}(x,y)\) to practice making contour plots.
domain(x=c(-5, 5), y=c(-5, 5)
domain(x=c(1, 5), y=c(1, 5)
domain(x=c(1,1), y=c(-1,1)))
domain(x=c(5,10), y=c(0,10)))
question id: drl-1
Using Active R chunk 2 draw a slice through the function along the line \(y=0\). Use the same \(x\)-domainas in the correct answer to the previous question.
In the slice_plot() command below, you will need to replace __tilde-expression___ and __domain__ with the correct syntax.
Which of these expressions will accomplish the task?
slice_plot(twins(x, y=0) ~ x, domain(x=c(-5,5)))
slice_plot(twins(x) ~ x, domain(y=c(-5, 5)))
slice_plot(twins(x, y=0) ~ x, domain(x=c(-5, 5), y=c(-5, 5)))
slice_plot(twins(x, y=0) ~ x + y, domain(x=c(-5, 5), y=c(-5, 5)))
question id: drl-2
Exercise 2 Many printed tables are meant to be used as functions, as in Figure 1; you plug in the input values and read off the output.
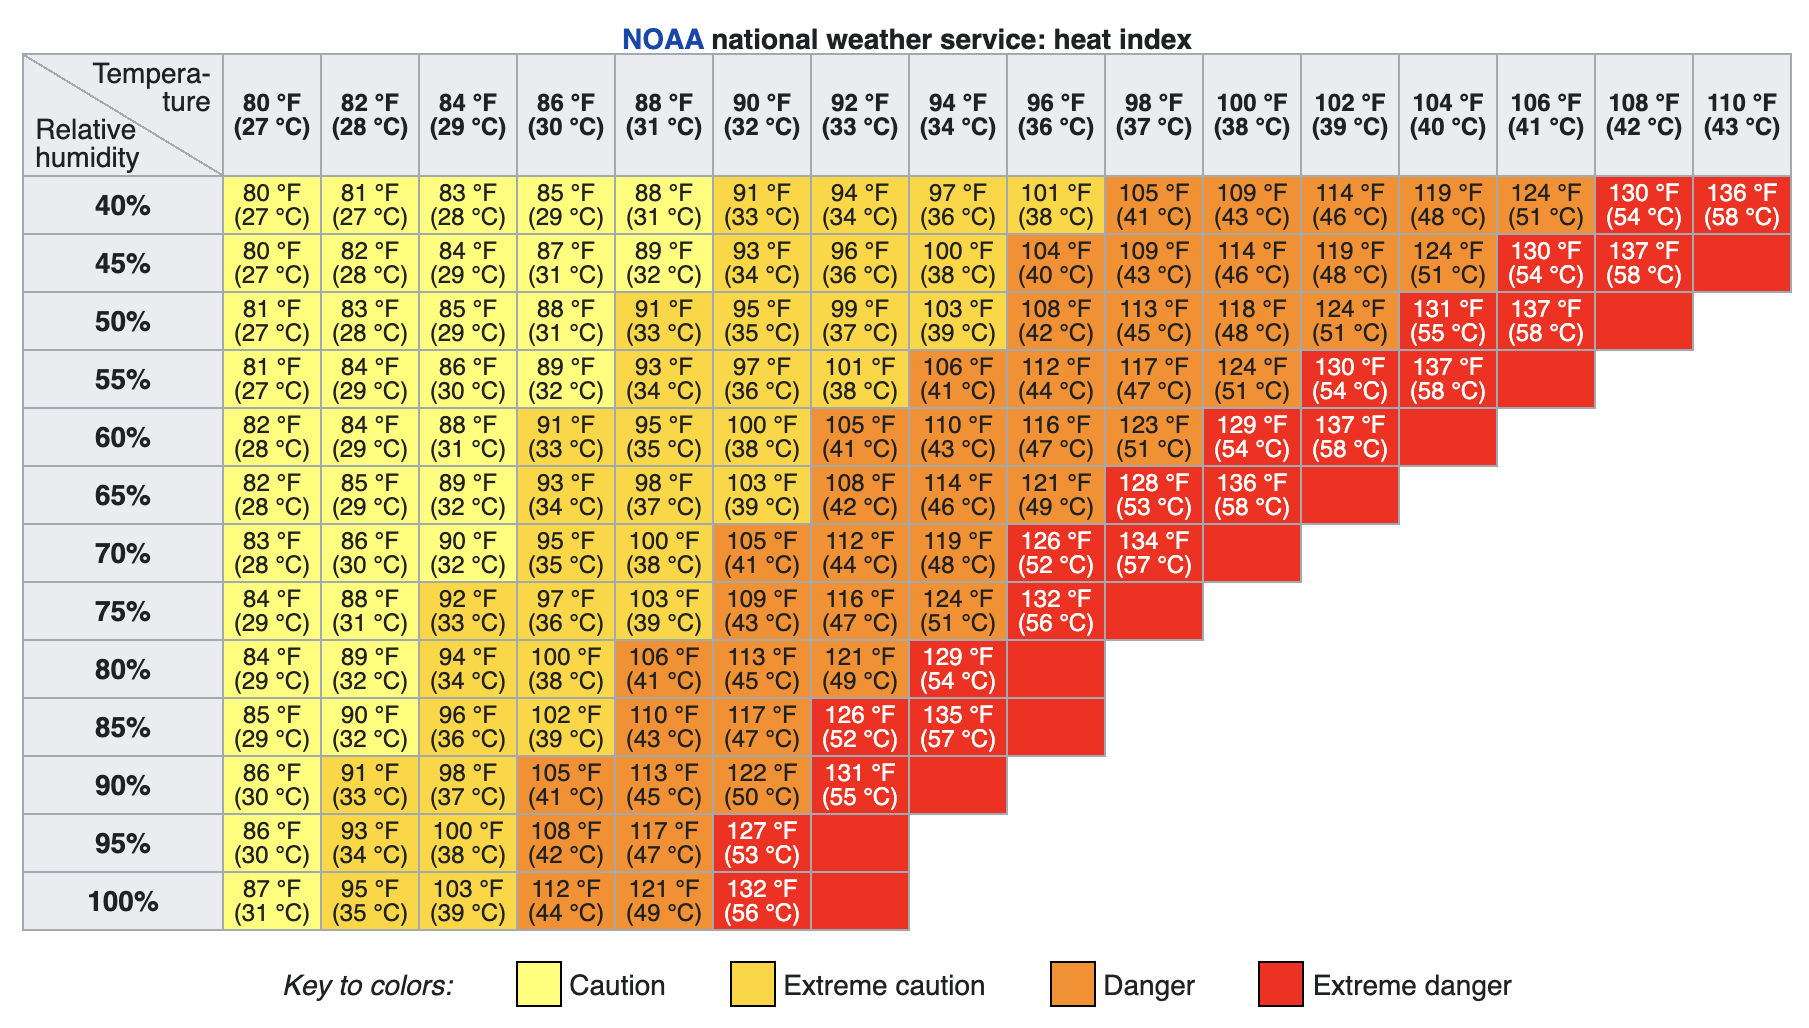
temperature and relative humidity
temperature and wind speed
temperature, latitude, and longitude
question id: dd-01-1
Figure 1 shows three different functions:
The heat index in \(^\circ\) F.
The heat index in \(^\circ\) C.
A caution warning level.
For inputs of 70% relative humidity and \(88^{\circ}\) F, what are the outputs of the three functions?
\(100^{\circ}\) F, \(38^\circ\) C, and “extreme caution”.
\(100^\circ\) F, \(38^\circ\) C, and “danger”.
\(100^\circ\) F, \(33^\circ\) C, and “extreme caution”.
question id: dd-01-2
Increase by \(2^\circ\) F
Increase by \(6^\circ\) F
Increase relative humidity to 80%.
question id: dd-01-3
\(6^\circ\) F per 10 percentage points humidity
\(6^\circ\) F
\(6^\circ\) F per 80% humidity.
question id: dd-01-r
\(98.4^\circ\) F
\(101^\circ\) F
The table does not say.
question id: dd-01-5
question id: dd-01-6
Exercise 3 The model \[\hspace{-2in}\text{price}(\text{livingArea}, \text{bedrooms}, \text{bathrooms}) \equiv\\\] \[ \ \ \ \ \ \ \ \ \ \ \ \ \ \ \ \ \ \ \ \ \ \ 21000 + 105\,\text{livingArea} - 13000\, \text{bedrooms} + 26000\, \text{bathrooms}\] is described in the text as being a linear combination of functions. Which of these best describe those functions?
There are no functions, just inputs.
Three identity functions, each of which takes a different input.
Four identity functions, each of which takes a different input.
Three identity functions, each of which takes a different input, and a fourth function, namely the constant function \(\text{const}(x) \equiv 1\)
question id: identity-constant
Exercise 4 Even if you don’t yet have a theoretical understanding of how to construct functions with multiple inputs from data, you can R/mosaic operations for doing so. A key function is fitModel(), which like makeFun(), constructs a function. And, like makeFun(), you need to use a tilde expression to specify the model formula. But, unlike makeFun(), you can leave it to the computer to find the parameters that will make the function align with data.
To illustrate, we can construct a housing-price model from the SaratogaHouses data:
price() function to inputs, we are using the names of the inputs explicitly. To write the command price(2000,3,2) risks mixing up which input is which.Use the function in the ordinary way. For instance, here is what the model has to say about the anticipated sales price of a house with 2000 square feet of living area, three bedrooms, and two bathrooms.
For technical reasons, the functions created by fitModel() have a lot of computer-programming jargon in them, as you can see by constructing the model itself and then looking at the function. But you will also see the values of the parameters found by fitModel().
Exercise 5 Auckland, New Zealand is in a field of dormant volcanos. The highest, at 193 meters above sea level, is Maungawhau. Formerly, tourists could drive to the peak and look down into the crater, as seen in the picture.

The initial creator of R, Ross Ihaka, teaches at the University of Auckland. His digitization of a topographic map is easily plotted, as here:
The z-axis is height and is in meters. The x- and y-axes are latitude and longitude, measured in 10-meter units from a reference point. (So, \(x=10\) is 100 meters from \(x=20\).)
Get used to the presentation of the surface plot and how to rotate it and zoom in. To see the crater more clearly, you can rotate the surface plot to look straight downwards, effectively presenting you with a color-coded contour plot. Moving the cursor over the surface will display the \(x\) and \(y\) coordinates, as well as the \(z\)-value at that coordinate point.
question id: crater-location
question id: crater-color
If you were to climb up Maungawhau, at some point you would be at the same elevation as the low-point of the crater, even though you are outside the crater. Think of the contour that corresponds to that elevation. Let’s call it the “half-way” contour since it is roughly half-way up the volcano.
question id: crater-contour
Imagine that you are filling up the crater with water. At some point, the water rises to a level where it will spill over the lip of the crater.
question id: crater-lip