Chap 14 Review
\[ \newcommand{\dnorm}{\text{dnorm}} \newcommand{\pnorm}{\text{pnorm}} \newcommand{\recip}{\text{recip}} \]
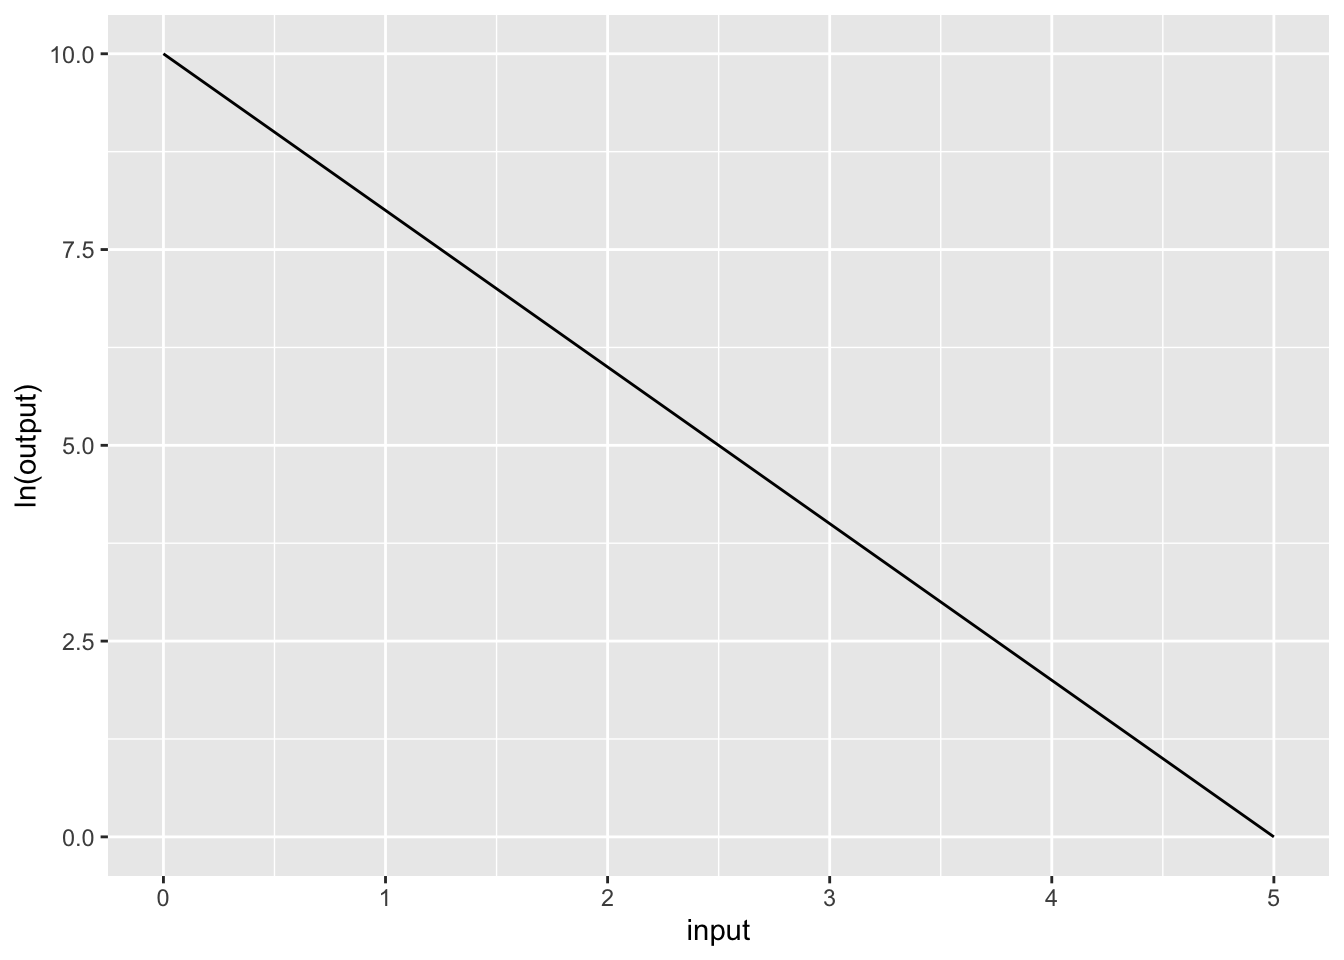
Exercise 1 What is the correct form for the relationship shown in Figure 1
\(g(x) \equiv e^{10} e^{-2 x}\)
\(g(x) \equiv 10 e^{-2 x}\)
\(g(x) \equiv e^{10} e^{-1.5 x}\)
\(g(x) \equiv e^{-1.5} e^{10 x}\)
\(g(x) \equiv 10 x^{-1.5}\)
question id: drill-Scales-1
Exercise 2 Which of these is the better modeling relationship for the following scenario: Your data looks linear on a semi-log plot.
Power-law Exponential Logarithmic
question id: drill-Scales-1b
Exercise 3 Which of these is the better modeling relationship for the following scenario: Your data looks linear on a log-log plot.
Power-law Exponential Logarithmic
question id: drill-Scales-1c
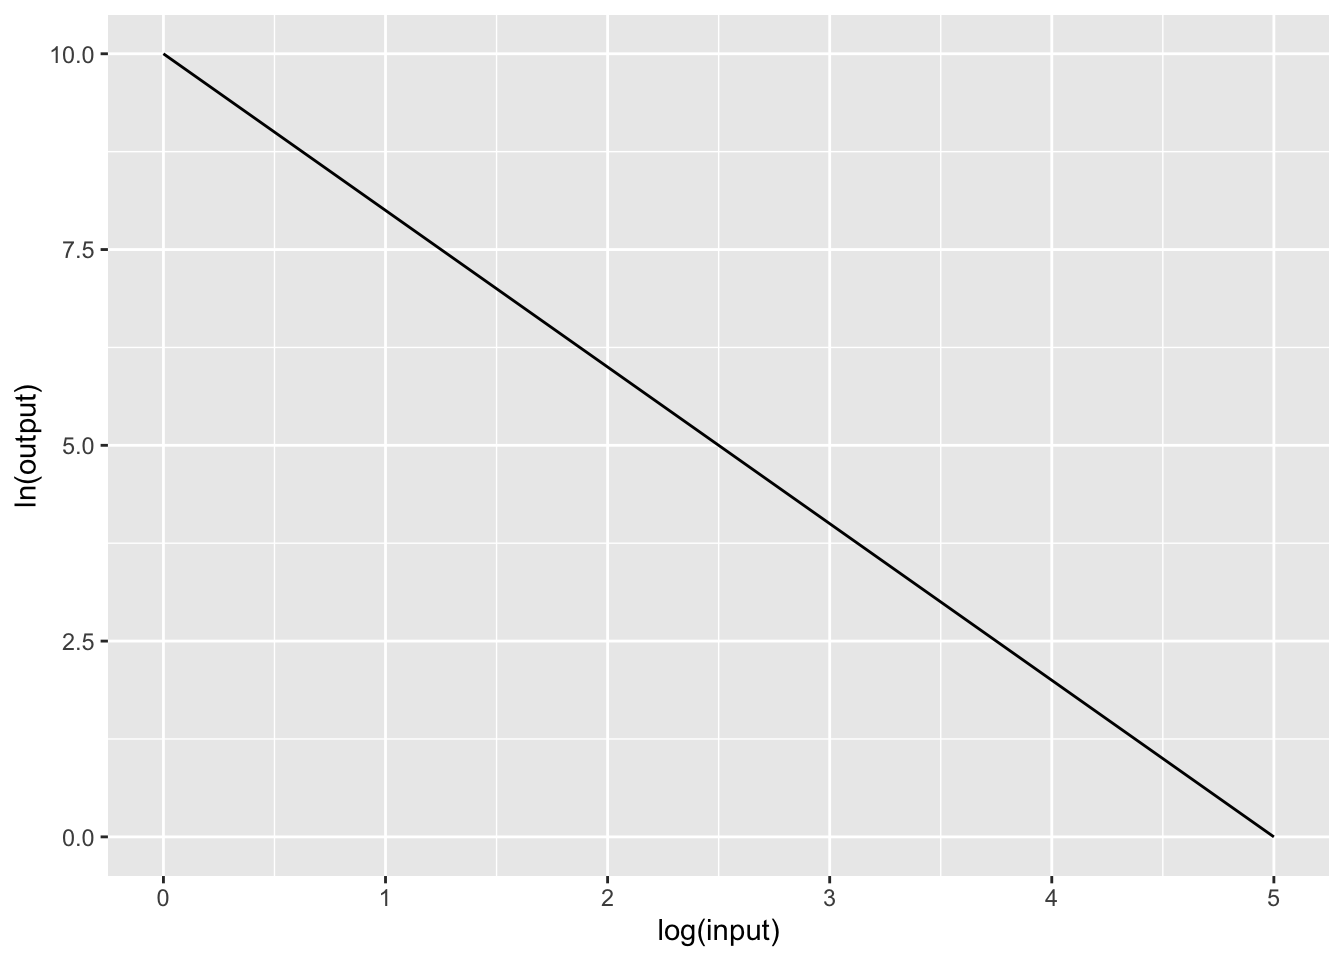
Exercise 4 What is the correct form for the relationship shown in Figure 2?
\(g(x) \equiv 10 x^{-2}\)
\(g(x) \equiv e^{10} e^{-1.5 x}\)
\(g(x) \equiv e^{10} x^{-2}\)
\(g(x) \equiv e^10 x^{-1.5}\)
question id: drill-Scales-2
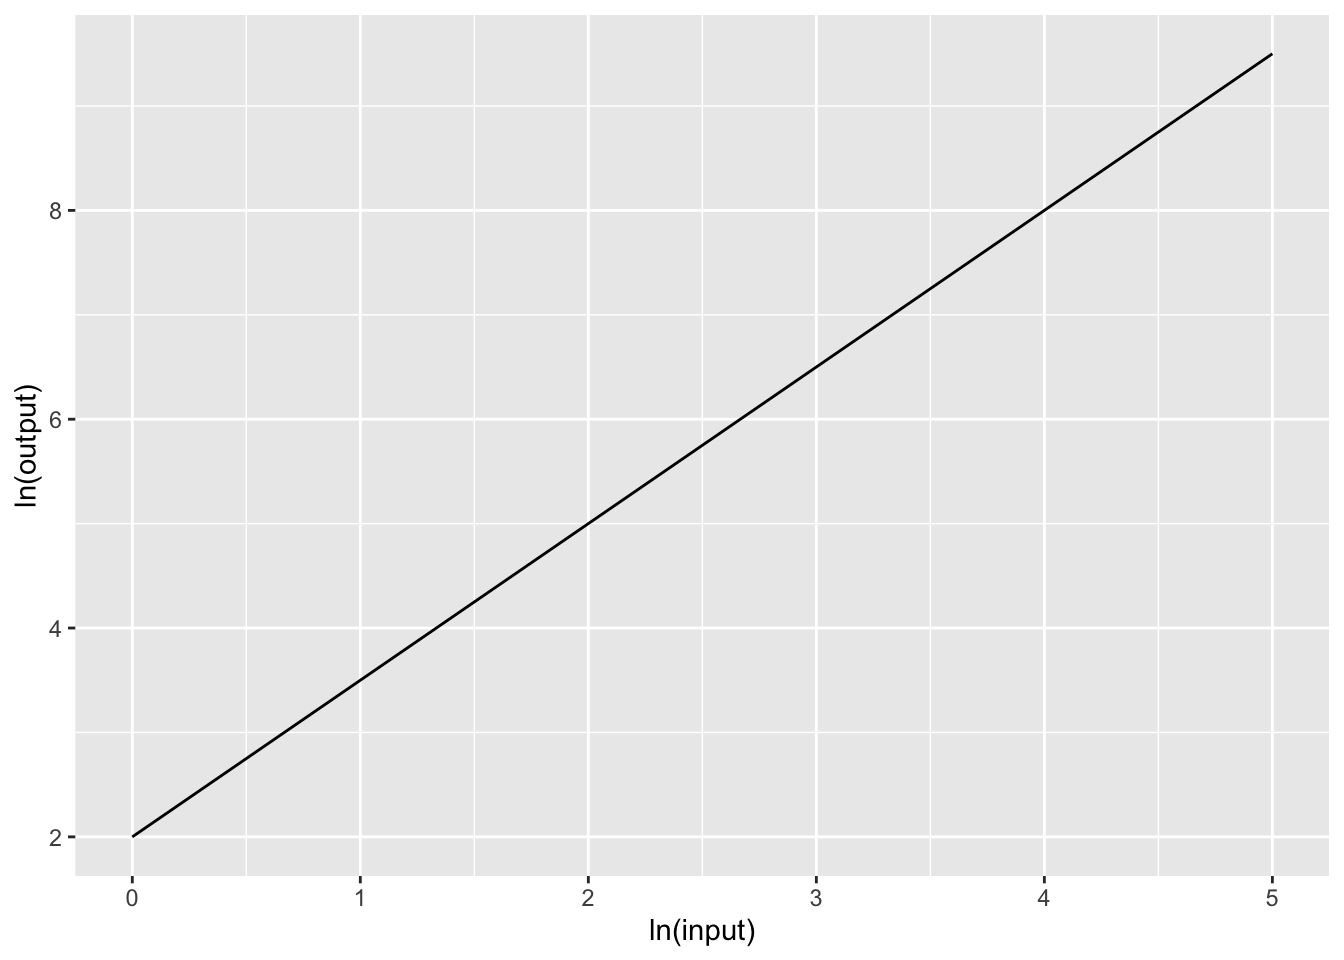
Exercise 5 What is the correct form for the relationship shown in Figure 3?
\(g(x) \equiv e^{2} e^{1.5 x}\)
\(g(x) \equiv 2 x^{1.5}\)
\(g(x) \equiv e^{2} x^{1.5}\)
\(g(x) \equiv e^{2} x^{2}\)
\(g(x) \equiv e^2 x^{-1.5}\)
question id: drill-Scales-3
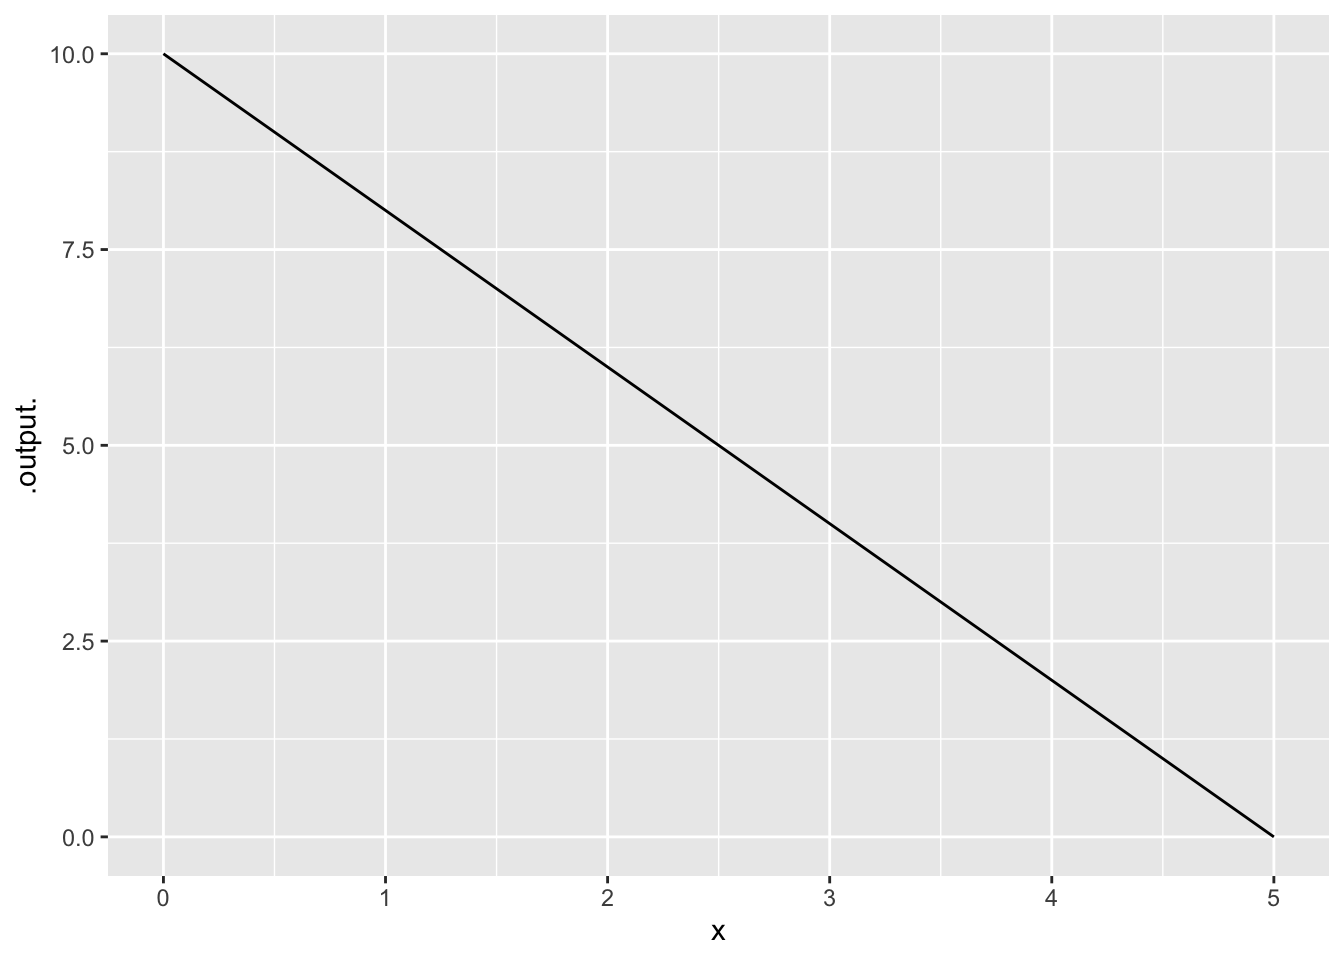
Exercise 6 Figure 4 shows a horizontal axis for a graph. How can you tell that this is a logarithmic axis?
The labels are all multiples of 2.
The labels are evenly spaced and each label is a factor of 2 larger than the previous one.
Trick question. It is not a log scale.
question id: drill-Scales-4
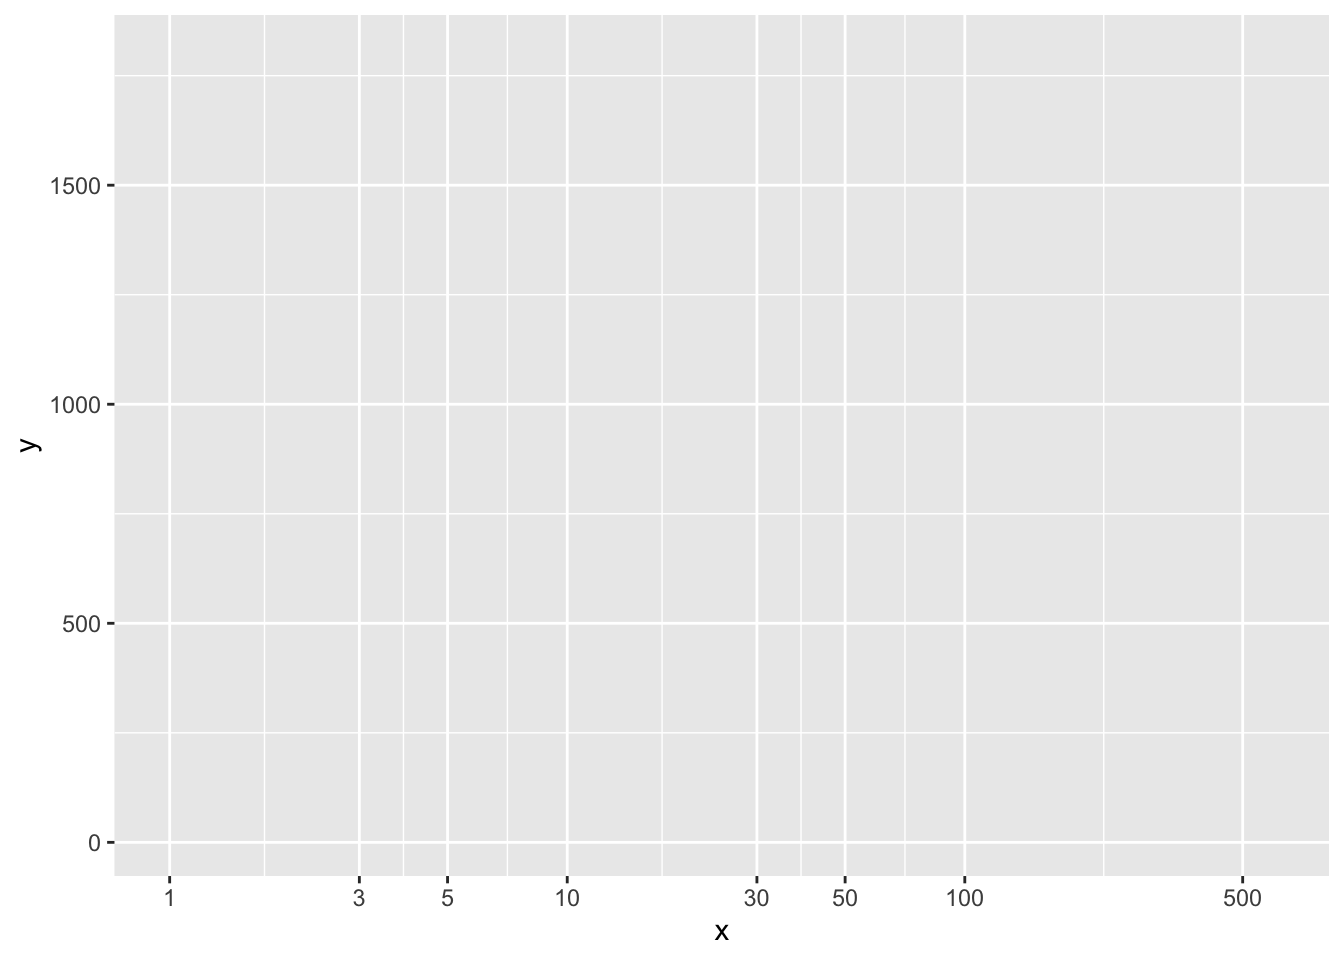
Exercise 7 Figure 5 shows a horizontal axis for a graph. How can you tell that this is a logarithmic axis?
The labels are 1, 3, 5, 10, …
The labels are evenly spaced and each label is a factor of 3 larger than the previous one.
The 3 label is about halfway between the 1 and 10 label for each decade, and the 1 and 10 labels have the same spacing for every decade.
Trick question. It is not a log scale.
question id: drill-Scales-5
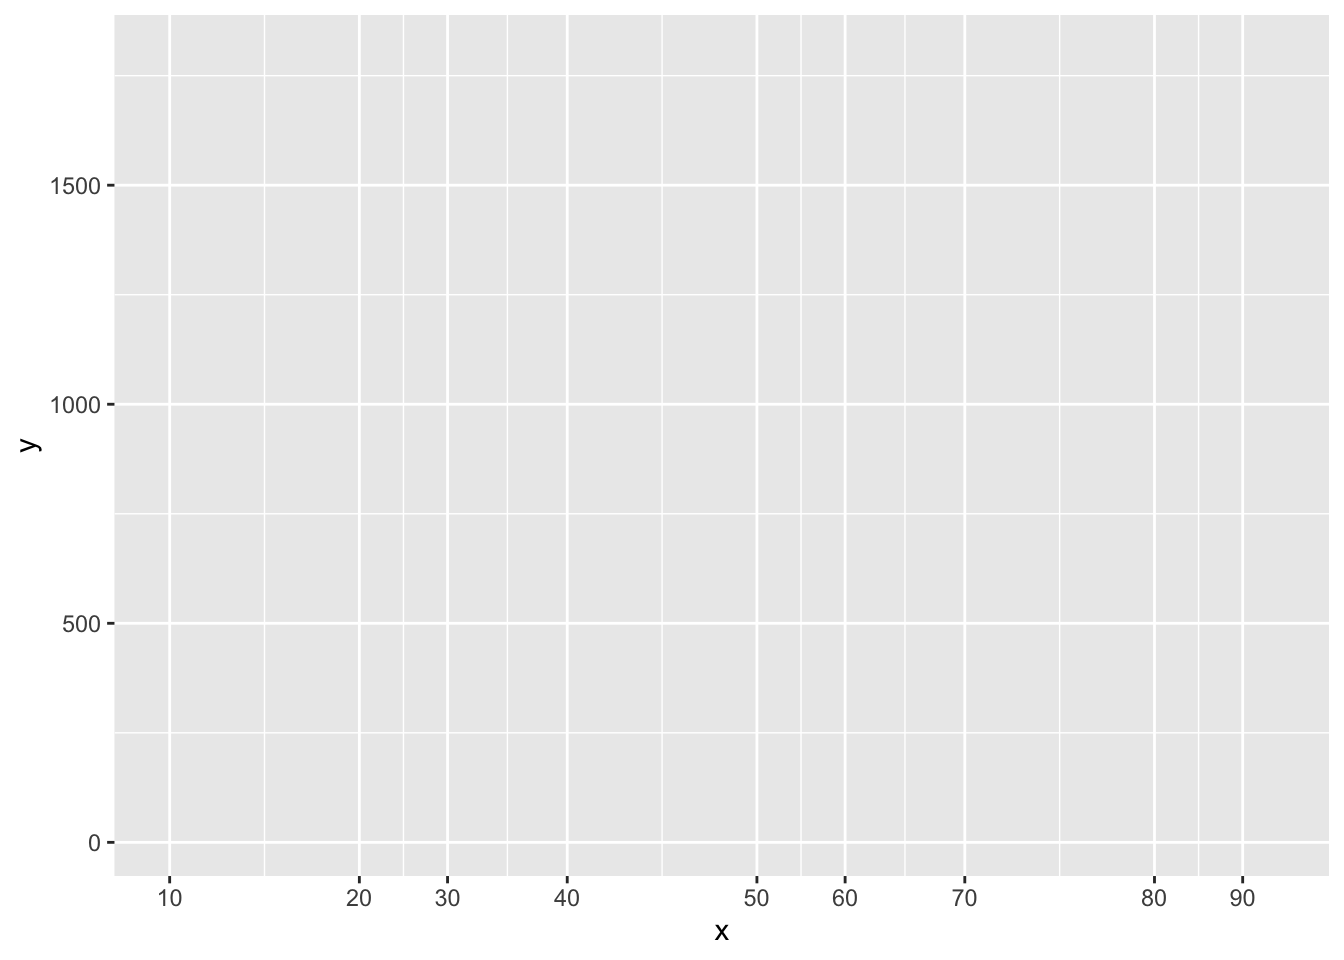
Exercise 8 Figure 6 shows a horizontal axis for a graph. How can you tell that this is a logarithmic axis?
The labels are 10, 20, 30, 40, …
Each label is 10 + the previous label.
The 3 label is about halfway between the 1 and 10 label for each decade, and the 1 and 10 labels have the same spacing for every decade.
Trick question. It is not a linear scale.
question id: drill-Scales-6
No answers yet collected