Chapter 22 DRAFT: Loss functions
NOTE IN DRAFT: REVISIT THE “HBC” example in the classifier-error chapter ….
Of course, you want to build the best possible classifier. But you need to think carefully what “best” means. If your only goal were to reduce the risk of developing high blood pressure, your classifier would be extremely simple: direct everyone to participate in the risk-reduction program. But you have other goals as well. For people whose risk is already low, participation in the diet may not be worthwhile for the patient or for the health benefits company. So in addition to reducing risk, you likely have a goal of minimizing expense and disruption of patients’ lives. This kind of trade-off is very common when making decisions.
To illustrate, we’ll work with the National Health and Nutrition Evaluation Survey (NHANES) and will build a classifier for hypertension (high blood pressure) based on age, sex, and body mass index (BMI). The output of the classifier – in the form of a probability of developing high blood pressure – will be used to recruit patients to a risk-reduction program.
22.1 The loss function
The NHANES data has absolutely nothing to say about the benefits and costs of the risk reduction-program, but for the purpose of the example, we’ll imagine that they are a function of whether the person would have developed high blood pressure (in the absence of the risk-reduction program) and whether the person was invited to participate. This loss function gives four possible hypothetical outcomes, each of which is associated with a relative net benefit or cost.
- Would have developed and invited to program: net benefit 10
- Would have developed and not invited: net benefit -5
- Would not have developed and invited: net benefit -2
- Would not have developed and not invited: net benefit 0
It helps to have a way to describe these hypothetical outcomes in general terms. The statistical convention involves the words “positive” and “negative” used to describe the outcome of whether the person was, in this example, invited to participate in the risk-reduction program. And, rather than saying “would have developed” or “would not have developed”, the words “true” and “false” are used to indicate whether the positive or negative result would have been appropriate. For example, a person who would not have developed high blood pressure but was nonetheless invited to the program would be a “false positive”: positive because he or she was invited, but false because the invitation was not appropriate for this person. Using this system of naming, the four hypothetical outcomes and their respective losses are:
- True positive: loss -10
- False negative: loss 5
- False positive: loss 2
- True negative: loss 0
22.2 Classification and the loss rate
According to the American College of Cardiology’s 2017 definition (al. 2018), hypertension is defined as a systolic blood pressure above 130 mmHg or a diastolic pressure of 80 mmHg. (Blood pressure is reported as two numbers, e.g. 125 over 75. The first is systolic pressure, the second diastolic.)
To build the classifier, we’ll take the NHANES data and divide it at random into two data frames: the training data and the testing data. Figure 22.1 shows a classifier built using the training data. The output of the classifier is a number: a probability of having hypertension.
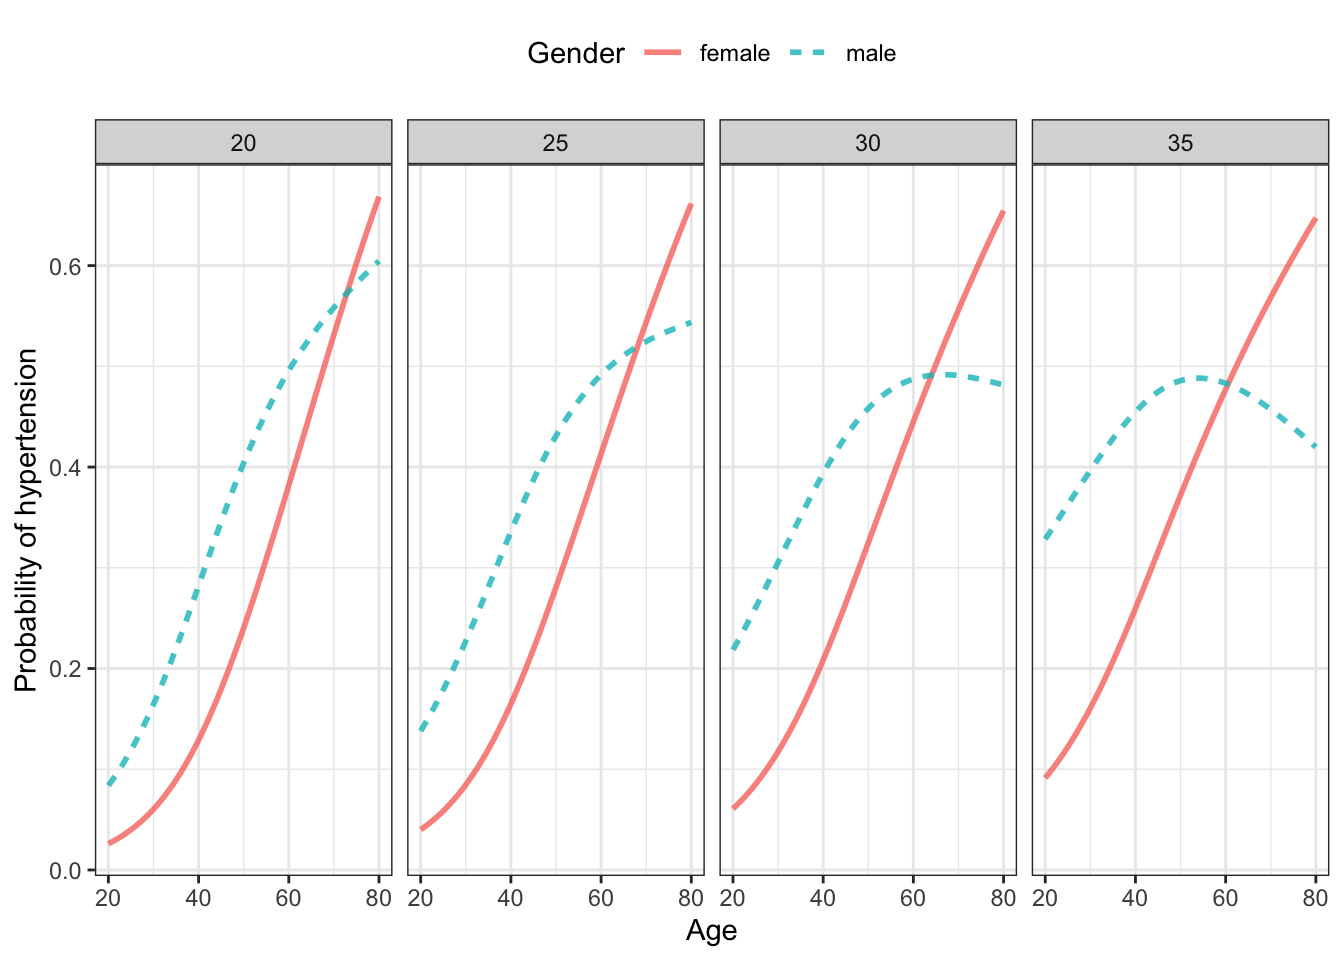
Figure 22.1: A classifier for hypertension using as input age, sex, and body-mass index (BMI) trained on the NHANES data. Note: (This may not be a “good” classifier. That’s what we’re going to try to find out in the text.)
Since the purpose of the classifier is to decide when to invite (or not) a patient to the risk-reduction program, we need to have a way to translate the classifier output into an action. Classifiers assign a probability to each possible outcome, in this case “hypertension” or not. To use the classifier for its purpose, that probability has to be converted to an action: “invite” or not. This conversion is often framed as a decision threshold. If the probability is higher than the decision threshold, the person will be invited to the program. If not, the person will not be invited.
It may be surprising for a person encountering the use of classifiers for the first time to hear that using a threshold of 50% may not be the best choice. For instance, if the cost of the program is low (for both the patient and the company), it may be worthwhile to invite people whose risk is only, say 10%. On the other hand, if the the risk-reduction program is costly, intrusive, and not very effective, perhaps only the people at very high risk ought to be invited.
For the sake of illustration, let’s set the threshold at 40%, keeping in mind that we may find later that another value would be better for our purpose.
In order to assess the performance of the classifier, we need to know how often it produces each of the four possible outcomes: true positive, false positive, false negative, true negative. This is where the testing data set comes in. The testing data values for the explanatory variables are used as input to the classifier. For each row in the test data, as seen in Table 22.1, the classifier produces a probability that the person will develop hypertension. This probability is compared to the decision threshold (40% in this example) to generate an action: either invite the person to the risk-reduction program or not, that is, either positive or negative.
Since the testing data contains the a record of whether the person actual did develop hypertension, we can figure out whether each positive or negative decision was correct, that is, was true or false.
Table 22.1: Feeding the explanatory variables into the trained model produces the model output: a probability. The action will be positive when that probability is greater than the selected threshold (40% in this example), and negative otherwise. By comparing the action to the actual result we can determine which actions were “true” or “false”.
| Gender | BMI | Age | model_output | action | actual_result | outcome |
|---|---|---|---|---|---|---|
| male | 32.22 | 34 | 0.3767194 | negative | hyper | false negative |
| male | 32.22 | 34 | 0.3767194 | negative | hyper | false negative |
| male | 23.69 | 58 | 0.4815878 | positive | not | false positive |
| male | 26.60 | 50 | 0.4396804 | positive | hyper | true positive |
| female | 19.73 | 56 | 0.3211704 | negative | not | true negative |
| male | 36.32 | 54 | 0.4921195 | positive | not | false positive |
| male | 36.32 | 54 | 0.4921195 | positive | not | false positive |
| male | 25.95 | 36 | 0.3041659 | negative | hyper | false negative |
| female | 27.18 | 64 | 0.4770387 | positive | hyper | true positive |
| female | 30.60 | 51 | 0.3423614 | negative | not | true negative |
| … and so on for 2,918 rows altogether. |
Table ?? shows the results on each person in the testing data. The performance of the classifier is indicated by how often each of the four possible outcomes occurred. Table ?? is this simple summary.
Table 22.2: The performance of the hypertension classifier using a decision threshold of 40%.
| outcome | loss | n | proportion |
|---|---|---|---|
| true positive | -10 | 673 | 0.23 |
| false negative | 5 | 336 | 0.12 |
| false positive | 2 | 726 | 0.25 |
| true negative | 0 | 1183 | 0.41 |
The loss corresponding to each outcome is shown in Table ?? so that we can reduce the performance to an overall loss rate for the classifier. For each outcome, multiply the loss by the proportion and add up the four numbers. For this classifier and decision threshold (40%), the loss rate is -1.2.
22.3 Accuracy
In the hypertension classifier, we introduced a loss function without much explanation. In actual work, the data scientist would interview experts and decision makers to construct the loss function. In many cases, the best that can be achieved is a kind of guess: an opinion about which outcomes are better or worse than others.
Many people object to using an “opinion” to guide decisions. They argue for a way of measuring performance that is more objective. Of course, “objective” sounds good, but the goal of objectivity ignores a reality of decision making: good decisions always depend on how we value outcomes, what we choose to count as positive or negative, how much emphasis to give to each. So embrace the potential subjectivity of loss functions, but be careful that loss functions you construct properly reflect the values held by decision makers.
One commonly used loss function counts “true” outcomes at a gain of 1 and “false” outcomes at a gain of zero. The result of applying this loss function to the classifier performance is called the accuracy. Looking at Table ??, the accuracy is 0.22 + 0.41 = 0.63, that is, 63%. Closely related is the classifier error rate, which for our classifier is one minus the accuracy or 37%.
Although the accuracy (or the error rate) is often used to summarize the performance of classifiers, this is a poor practice. To see this, imagine a classifier where the output does not depend on the input, always having an output “not hypertensive.” This classifier would still have an accuracy, on the testing data, of 65%, simply because 65% of the rows in the testing data have an actual state of not hypertensive. But the classifier would be useless.
22.4 The decision threshold
In our hypertension example, we used a decision threshold of 40%. In actual work, however, the decision threshold is your own choice. But some choices are better than others. The right way to choose a decision threshold is to try many possibilities and pick the one that gives the best overall performance.
For instance, our hypertension loss function specifies that the loss for false negatives is more than twice as large as for false positives. This suggests we could build a better classifier by by reducing the number of false negatives even though that comes at the expense of increasing false positives. Doing this is easy: just reduce the decision threshold. The lower threshold will result in more positive outcomes and fewer negative ones, perhaps reducing the overall loss.
Table 22.3: A tally like Table ?? but with several different decision thresholds.
| outcome | loss | 0% | 10% | 20% | 30% | 40% | 50% | 60% | 70% |
|---|---|---|---|---|---|---|---|---|---|
| false negative | 5 | 0.00 | 0.01 | 0.03 | 0.06 | 0.12 | 0.26 | 0.32 | 0.35 |
| true positive | -10 | 0.35 | 0.34 | 0.32 | 0.28 | 0.23 | 0.09 | 0.03 | 0.00 |
| true negative | 0 | 0.00 | 0.08 | 0.20 | 0.30 | 0.41 | 0.57 | 0.64 | 0.65 |
| false positive | 2 | 0.65 | 0.58 | 0.46 | 0.35 | 0.25 | 0.08 | 0.02 | 0.00 |
As the probability threshold is increased, the number of positive results goes down. This makes sense, a higher threshold makes it “harder” to get the “hyper” model result. Similarly, as the probability threshold is increased, the number of negative results goes up. This pattern is seen in every classifier that involves a threshold.
If your only goal in a classifier is to avoid false negatives (as with airport screening), turn the threshold to a very low level, perhaps 0. If your only goal is to eliminate false positives, turn the threshold to a very high level. Regrettably, there is a trade-off; reducing false negatives increases false positives, and vice versa.
Table 22.3: The overall loss rate when using different decision thresholds. A threshold of 10% minimizes the loss rate.
| thresh | loss_rate |
|---|---|
| 0% | -2.20 |
| 10% | -2.19 |
| 20% | -2.13 |
| 30% | -1.80 |
| 40% | -1.20 |
| 50% | 0.56 |
| 60% | 1.34 |
| 70% | 1.75 |
An appropriate goal is to minimize the total loss, which we can calculate by multiplying the rates of the various outcomes by the loss for that outcome. Table ?? shows the loss rate for each of the different decision thresholds in Table 22.3. The loss rate is minimized at a decision threshold of 10%. It seems that the benefits of inviting people at relatively low risk of hypertension to participate in the risk-reduction program more than makes up the excess cost of inviting those who, in the end, would not have developed hypertension.
22.5 IN DRAFT
REVISIT material in 026-classifiers-ORIGINAL.Rmd
References
al., Whelton PK et. 2018. “2017 Acc/Aha/Aapa/Abc /Acpm/Ags/Apha/Ash /Aspc/Nma/Pcna Guideline for the Prevention, Detection, Evaluation, and Management of High Blood Pressure in Adults: A Report of the American College of Cardiology/American Heart Association Task Force on Clinical Practice Guidelines.” J Am Coll Cardiol 71: e127–e248. https://www.acc.org/latest-in-cardiology/ten-points-to-remember/2017/11/09/11/41/2017-guideline-for-high-blood-pressure-in-adults.