Orientation
These are notes for the MAA sponsored minicourse Stats for Data Science at the 2020 Joint Mathematics Meetings in Denver, Colorado.
- Part A, Thursday, 1:00–3:00 pm
- This orientation
- A historical metaphor
- Graphics
- Computing
- Models
- Inference
- Part B, Saturday, 1:00–3:00 pm
This course is sponsored by the MAA. They ask all participants in their workshops to complete a very short evaluation form–this helps them in planning and in continuing to receive the funding that supports the mini-courses.
At the end of the workshop please go to the evaluation site.
During the workshop use this shared Google document to make comments, suggestions, recommendations, or criticisms, or to ask questions that you might not get to have answered during the workshop.
Objective
I start with the presumption that you are interested in teaching data science and trying to sort out the possible relationship between introductory-level statistics and data science.
My objective is to provide an outline of core components of an introductory statistics course that genuinely engages data science.
Remarkably, the statistical topics can be taught using paper-and-pencil techniques augmented with point-and-click web-based apps that are already available.
A curriculum, with only the essentials:
- Data organization
- Graphics
- Models (generalize graphics to many variables)
- present “hypothesis testing” as aiding decision making when model building
- Data collection, study design, experiment, …
We’ll cover mainly (3) with a little bit on (2)
The new elements …
Streamline visualization. Adopt contemporary graphical modalities and by-pass the catalog of traditional formats.
This frees up time in the your course, puts data at the center rather than theory, and avoids student confusion about why a particular style of graph is being used.
Consistently use functions and effect sizes to describe relationships.
The functions will have the form \(y = f(x, z)\) where- \(y\) is the response variable
- \(x\) and \(z\) are explanatory variables.
- \(z\) plays the role of a covariate, that is, a variable not of direct interest that may color the observed relationship between \(x\) and \(y\).
- \(\partial y / \partial x\) for continuous \(x\)
- \(\Delta y\) for categorical \(x\)
I will treat model fitting as a calculator function: something that happens automatically once the inputs are provided.
Generalize inference which allows the presentation to be streamlined and simplified and, at the same time, to be extended to settings not usually touched on in an introductory course.
- Ignore theoretical niceties that are of questionable utility or validity in real work, e.g.
one-tailed testsunequal variance tests
All inference will be about models and effect sizes. No methods, such as chi-squared, which produce only a p-value without an indication of the magnitude of the relationship.
Pay heed to how much precision is actually needed in a result. For instance there’s no good reason to suggest that a p-value is meaningful past the second digit. So bypass calculations that worry about the third digit.
- Ignore theoretical niceties that are of questionable utility or validity in real work, e.g.
Embrace causal reasoning from observational data. Teach students how to draw and recognize responsible conclusions about causation.
- Integrate statistical findings with real-world decision making.
reject the null?- cost functions
- trade-offs
- using statistical results in the context of larger frameworks.
Computing
I want to put aside the question of how much computing should be taught in (or before) introductory statistics.1 Instead, I’ll focus on teaching a course using only:
- paper and pencil estimation and calculation
- no-coding web apps that make detailed graphics and do precise calculations
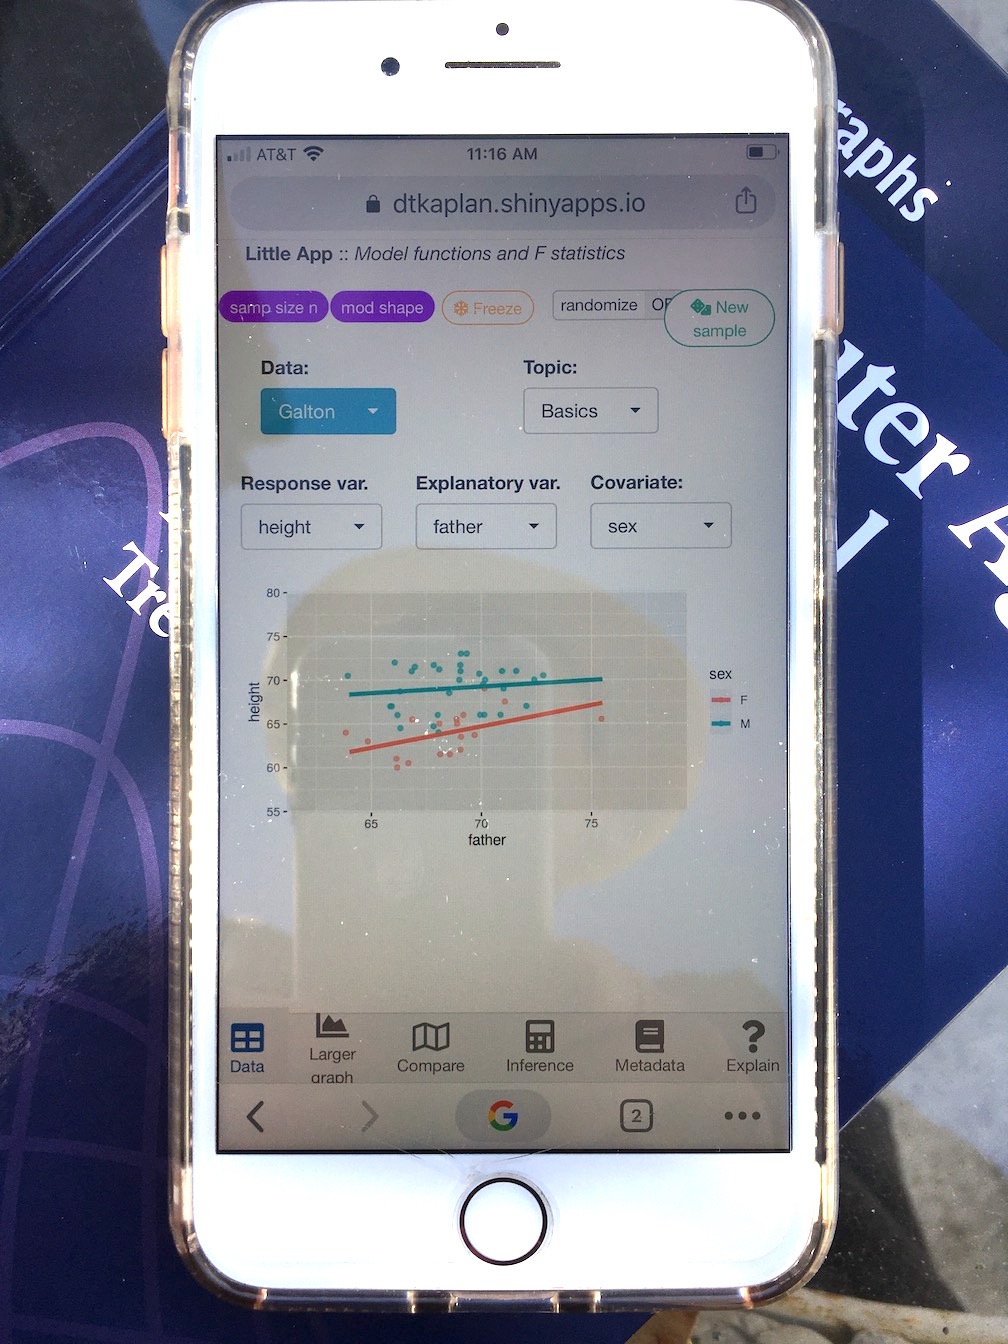
Drawing graphics, model fitting, and statistical calculations can be carried out using a point-and-click web app. This is displayed in a regular browser window and can be plausibly used with a smart phone. We’ll use this app later in the mini-course.
JMM 2020 Abstract
As universities and colleges rush to offer courses and even degree programs in data science, it’s fair to wonder whether data science is genuinely new or is merely a rebranding of statistics. This mini-course will introduce participants to important and substantial ways that a statistics course that genuinely engages data science differs from traditional statistics.These include an emphasis on prediction, classification and causality rather than the traditional focus on estimation and significance. During the mini-course, we’ll work through both theoretical and computational exercises from a new book, Stats for Data Science (available at https://dtkaplan.github.io/SDS-book/preface.html). The workshop is appropriate for anyone from a newcomer to statistical computing to experts. Some small groups in the mini-course will choose to use mouse-driven “Little Apps” to display data-science oriented statistical concepts. Others will choose to work with interactive R tutorials based on modern modeling and graphics packages in R. Participants should bring a laptop or tablet. All work will be browser based; there’s no need to install new software.
Resources
- Participant notes, comments, suggestions, questions, etc.
- Participant introductions
- Books
- Stats for Data Science textbook. The link is to the current draft of a textbook I am writing to explore how statistics can be taught in a way that genuinely embraces the typical goals of data-science practice.
- A Compact Guide to Classical Inference by Daniel Kaplan. This book deals with one small but important part of making a mental and teaching transition from a conventional intro stat course into a course suitable for data science. In particular, the Compact Guide approaches statistical description using model functions and, with this basis, unifies and simplifies the inferential settings typically covered in inferential stats. All those traditional settings–difference of means and of proportions, simple regression, inference on contingency tables, one-way analysis of variance, two-way analysis of variance, multiple regression–are translated into a single test statistic, F, with a simple formula and simple interpretations. For instance, statistical “significance”2 is addressed by the simple question, is \(F > 4\). Confidence intervals on differences and slopes are all shown to have the same form, proportional to \(1 \pm \sqrt{4 / F}\).
- Statistical Inference via Data Science by Chester Ismay and Albert Y. Kim. For the introductory-course instructor who is not shy of using R with her class and who wants to touch on non-statistical aspects of data science such as data wrangling, this can be good choice for a textbook. The statistical topics are conventional, but the book wisely leaves the mean-median-mode stuff for an appendix. In the sense that the presentation of statistics is based on regression, I see this book as a kind updating for data science and recent developments in R of Statistical Modeling. (See next entry). Statistical Inference is not as radical as Stats for Data Science, but for many instructors that’s probably a good thing. There are exercises (“learning checks”) and solutions.
- Statistical Modeling: A Fresh Approach by Daniel Kaplan was my attempt, circa 2010, to re-imagine what can be done in an introductory statistics course to make the course more relevant to genuine practice, take confounding seriously, and provide room for student creativity in framing statistical questions. So, instead of “do I use t or chi-squared?” the question becomes “what covariates are relevant and what are the implications of including them in a statistical analysis?”
- Computer Age Statistical Inference by Bradley Efron and Trevor Hastie. This is a concise review of classical statistical inference that is much broader than the Compact Guide* and particularly oriented to deep theoretical limitations of classical inference and a couple of generations of work to overcome those limitations.
- The Book of Why by Judea Pearl and Dana Mackenzie. This is a fantastic introduction to causal inference which, yes, does go beyond the pat “correlation is not causation” or “no causation without experimentation.”
- The Theory that Would not Die by Sharon Bertsch McGrayne. The subtitle is “How Bayes’ Rule Cracked the Enigma Code, Hunted Down Russian Submarines, and Emerged Triumphant from Two Centuries of Controversy” which aptly describe the book’s historical approach. This isn’t a textbook, but it is a good way to see why Bayes is important.
- Modern Data Science with R by Ben Baumer, Daniel Kaplan, and Nicholas Horton. This book covers a wide range of data science techniques, but wouldn’t be suitable for a statistics course.
- R for Data Science by Garrett Golemund and Hadley Wickham. Like Modern Data Science with R, it’s not a suitable book for a statistics course. But it’s an excellent (even canonical) choice to make sense of the recent generation of R data-science tools.
- Introduction to Data Science: Data Analysis and Prediction Algorithms with R by Rafael Irizarry. This book is based on Rafael’s notes for the HarvardX Data Science Series.
- Little Apps. These are web-based apps that provide statistical computing capabilities without coding. There are, of course, many other apps provided to the stat-ed community such as the Lock5 StatKey collections and Dan Adrian’s Happy Apps.
- Functions and F statistics. This is the Little App written specifically for the Compact Guide. It also happens to be the prototype for the next generation of Little Apps that are mobile-device ready.
- Regression models is a pre-cursor to the Functions and F statistics Little App. It explains the idea of model values, which are simply the values of a statistical model evaluated using the training data as input.
- Resampling and Bootstrapping demonstrates these ideas graphically.
- A few other Little Apps, developed as part of <StatPREP.org>, cover topics of the traditional intro course such as t-tests, the normal distribution and center and spread.
- Computing tutorials for starting with R
In my own courses I strongly emphasize technical computing and professional workflows.↩
Recently, Jeff Witmer at Oberlin College suggested replacing the misleading technical use of an everyday word with an utterly different meaning: significance. His suggestion is “discernible” and “discernibility”, as in “the difference is statistically discernible” or “one part of inference is statistical discernibility”.↩