Computing
Three levels of computing
- Web apps
- Scaffolded tutorials
- Blank canvas
More details below …
Computing essentials
How can we make computing accessible to everyone, both practically and intellectually?
Practical: Browser-based applications, web apps
Intellectual: Define a small set of essential, high-level skills.
- Draw a point plot. Up to four variables: y, x, color, facet.
- use jittering and transparency
- Construct a model:
y ~ x + zand visualize it with (1).- allow flexibility
- allow choice of architectures: machine-learning, bounded, unbounded.
- Evaluate a model at two different inputs: effect size
- Compare two models, e.g.
y ~ 1andy ~ 1 + x- cross-validated prediction error
- F
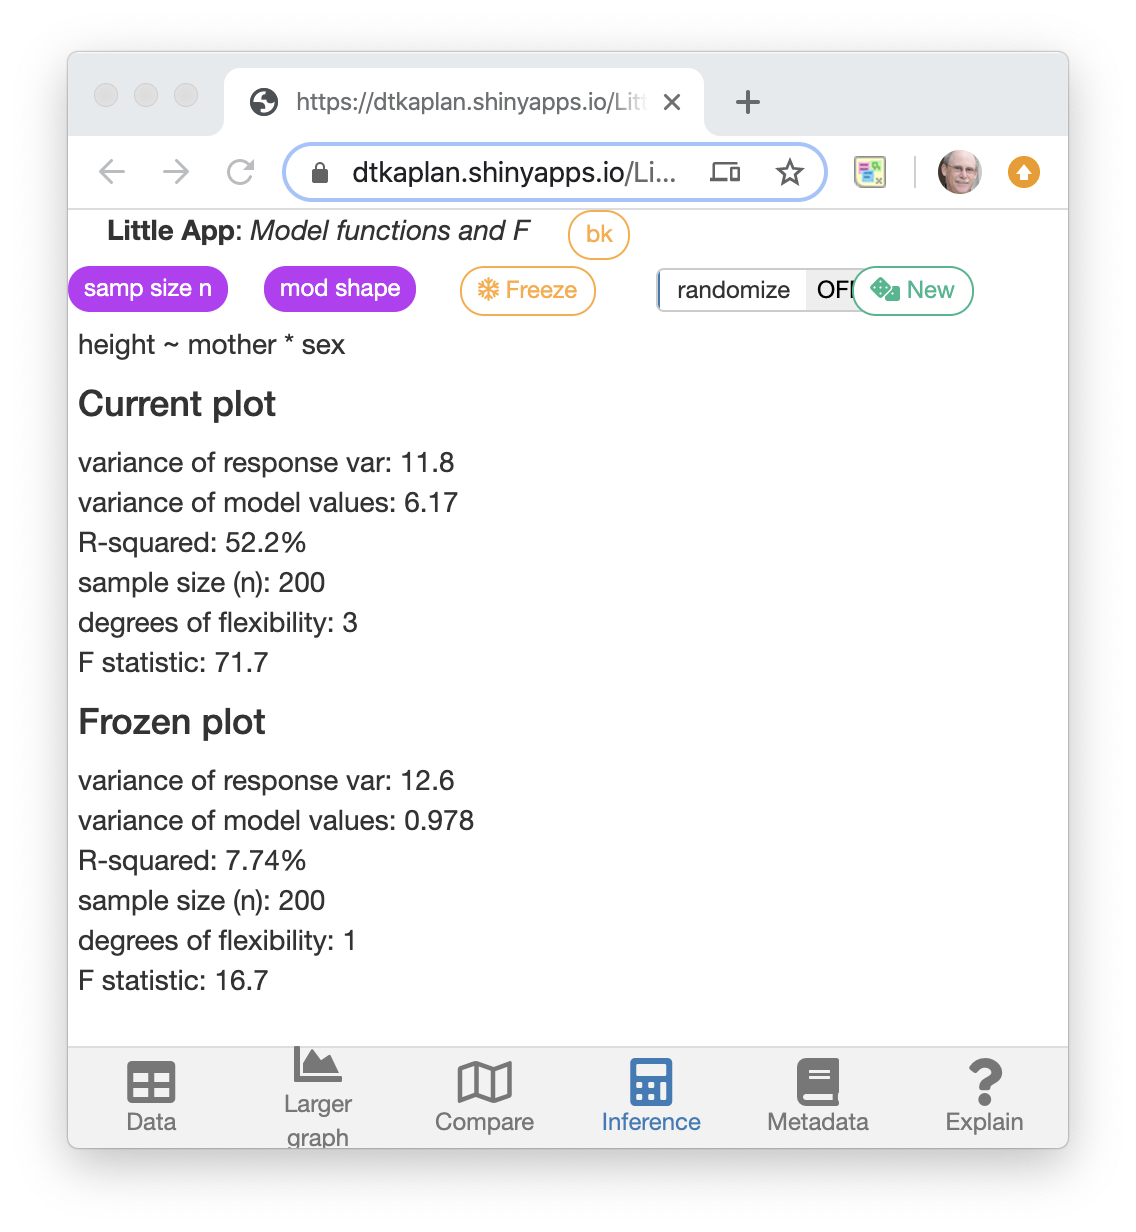
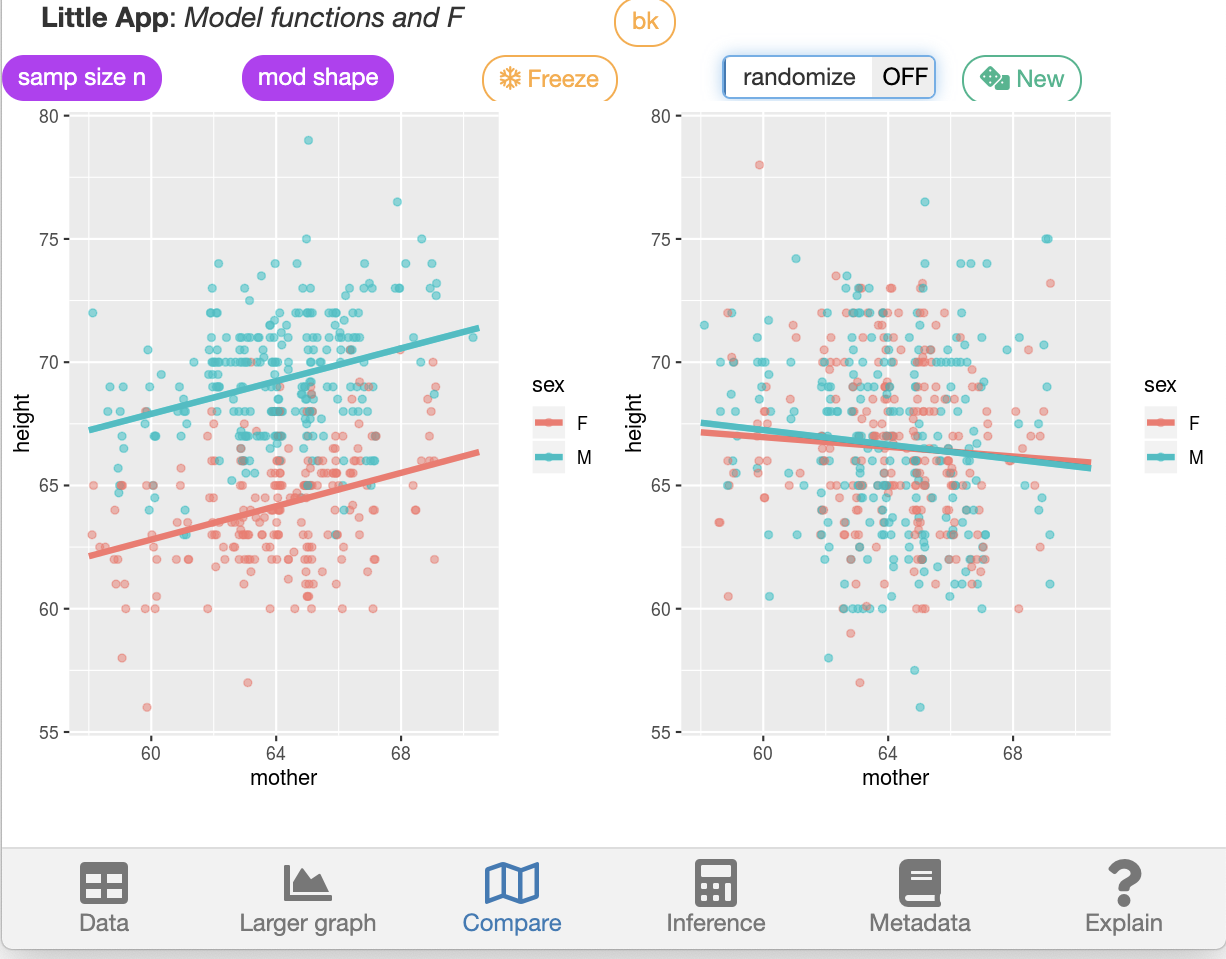
A prototype app
dtkaplan.shinyapps.io/LittleAppF
But I’m not sure that connectivity here will be adequate.
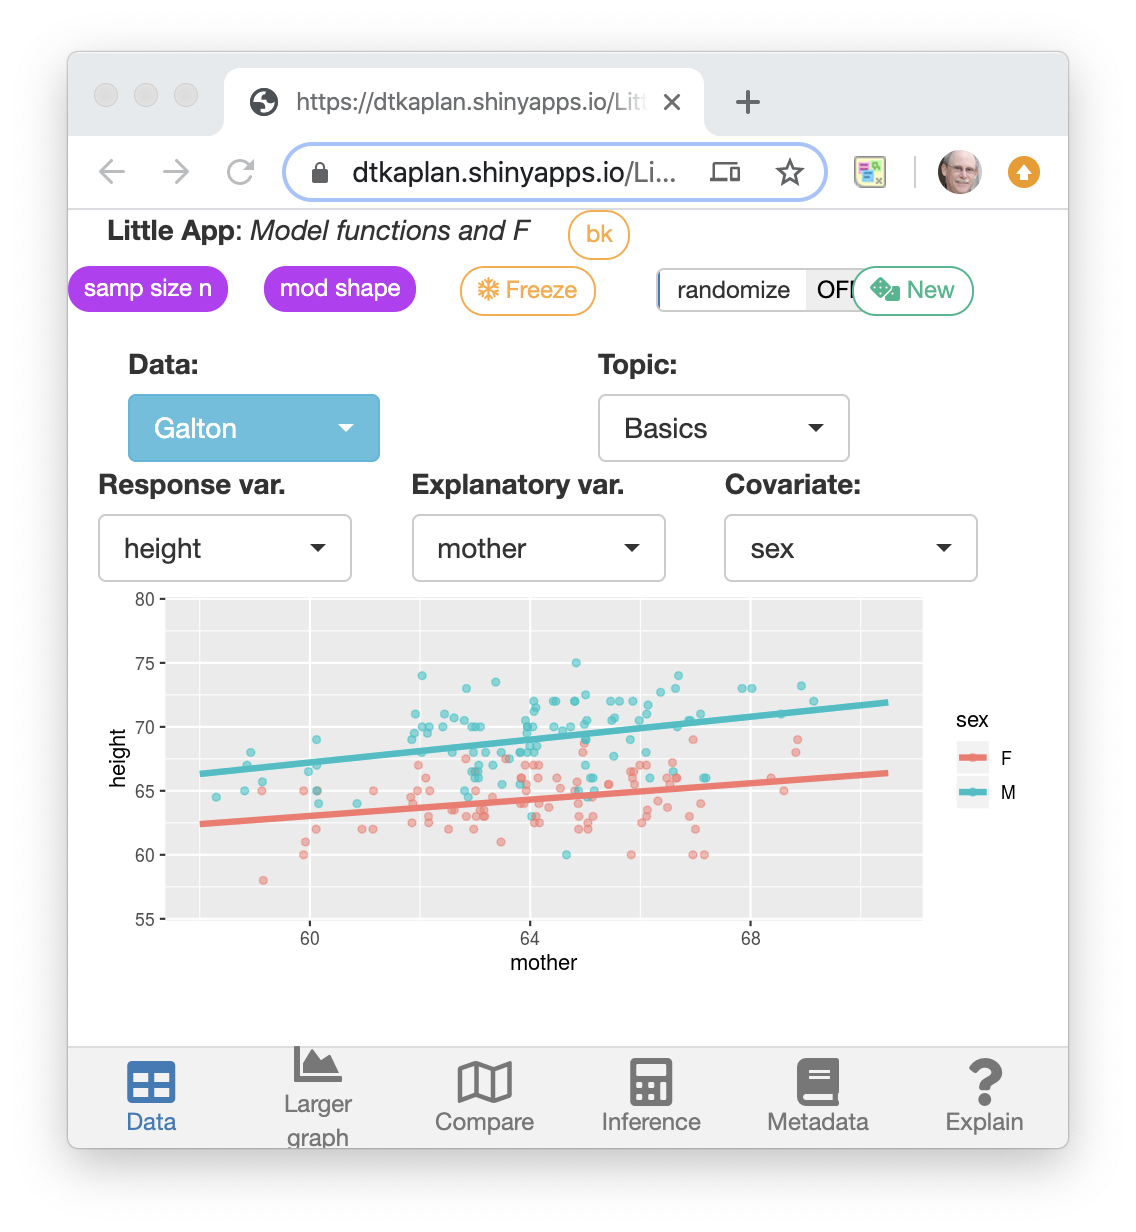
1. Create a model
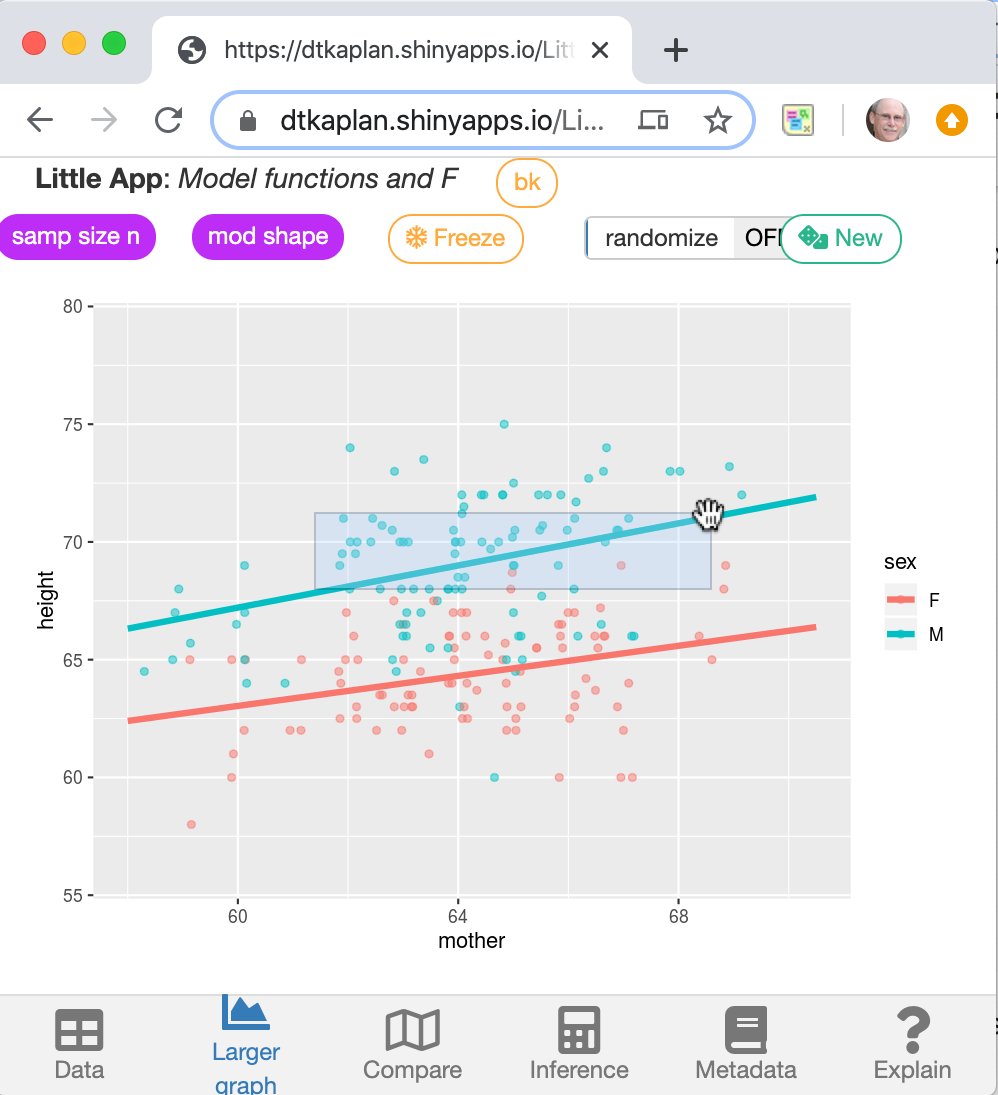
 ## 2. Evaluate and find effect size
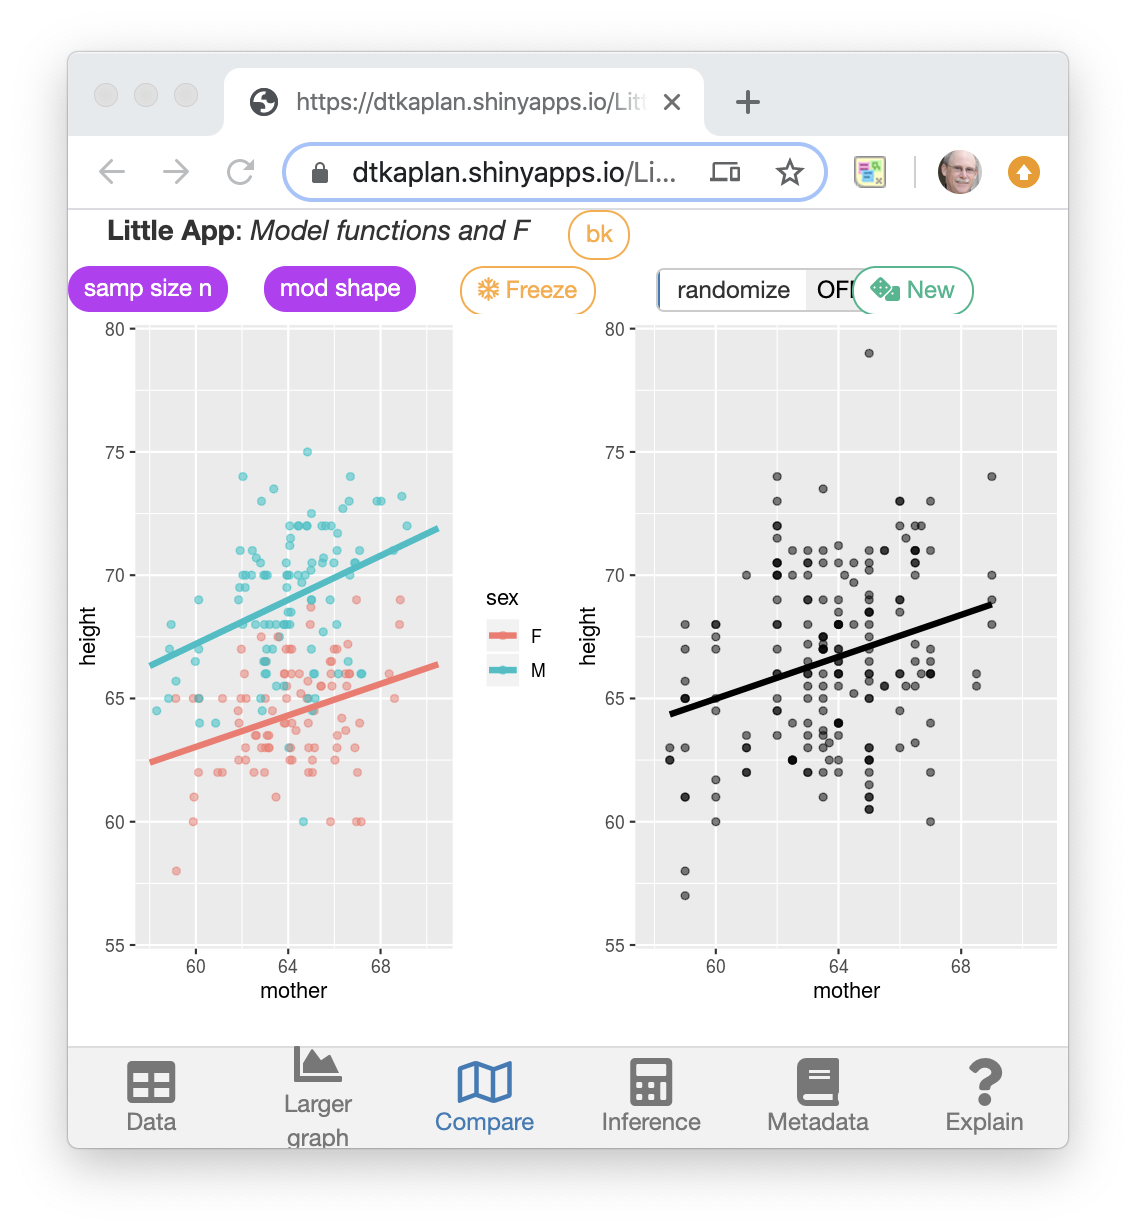
3. Compare models
1. Apps
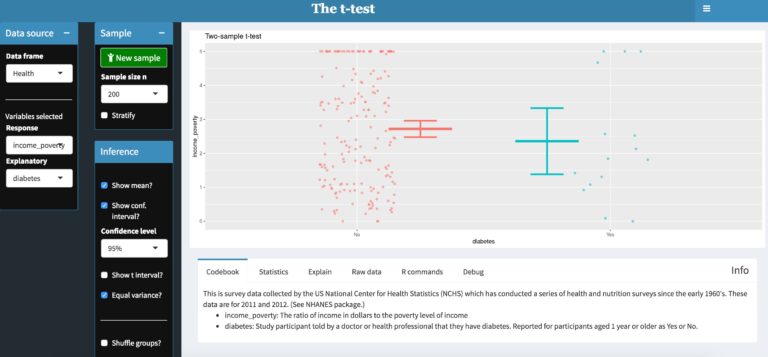
Little Apps.
Written by me in part to support the StatPREP.org project, and in part for my own purposes. Almost all the Little Apps are centered around the display of data and the ability of students to explore multiple response and explanatory variables.
A prototype of a new format, suitable for mobile devices, was written to display the F-based inference calculations that are at the core of this workshop.
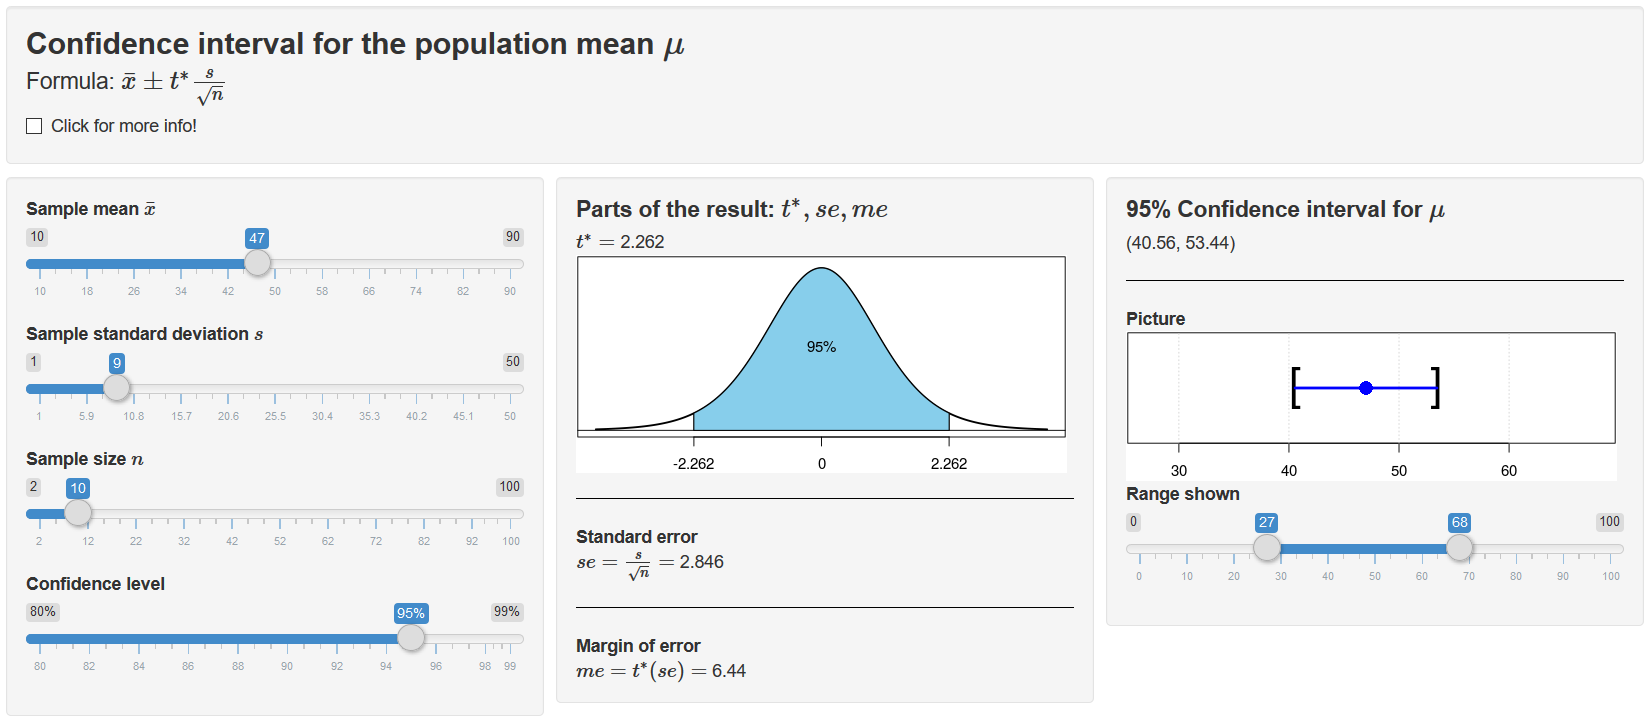
Penn State BOAST
BOAST is the Book of Apps for Statistics Teaching. Chapters contain a large number of apps with demonstrations, formative assessment (presented as games). It’s a lovely resource for exploring diverse statistical concepts. The Little Apps seem austere by comparison.
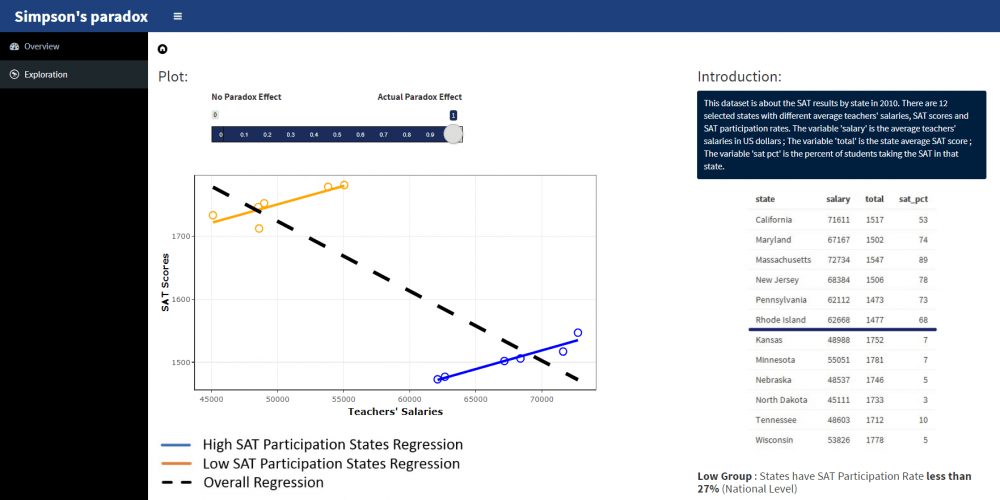
Happy Apps
Written by Dan Adrian at Grand Valley State University. These are also written in R/Shiny.
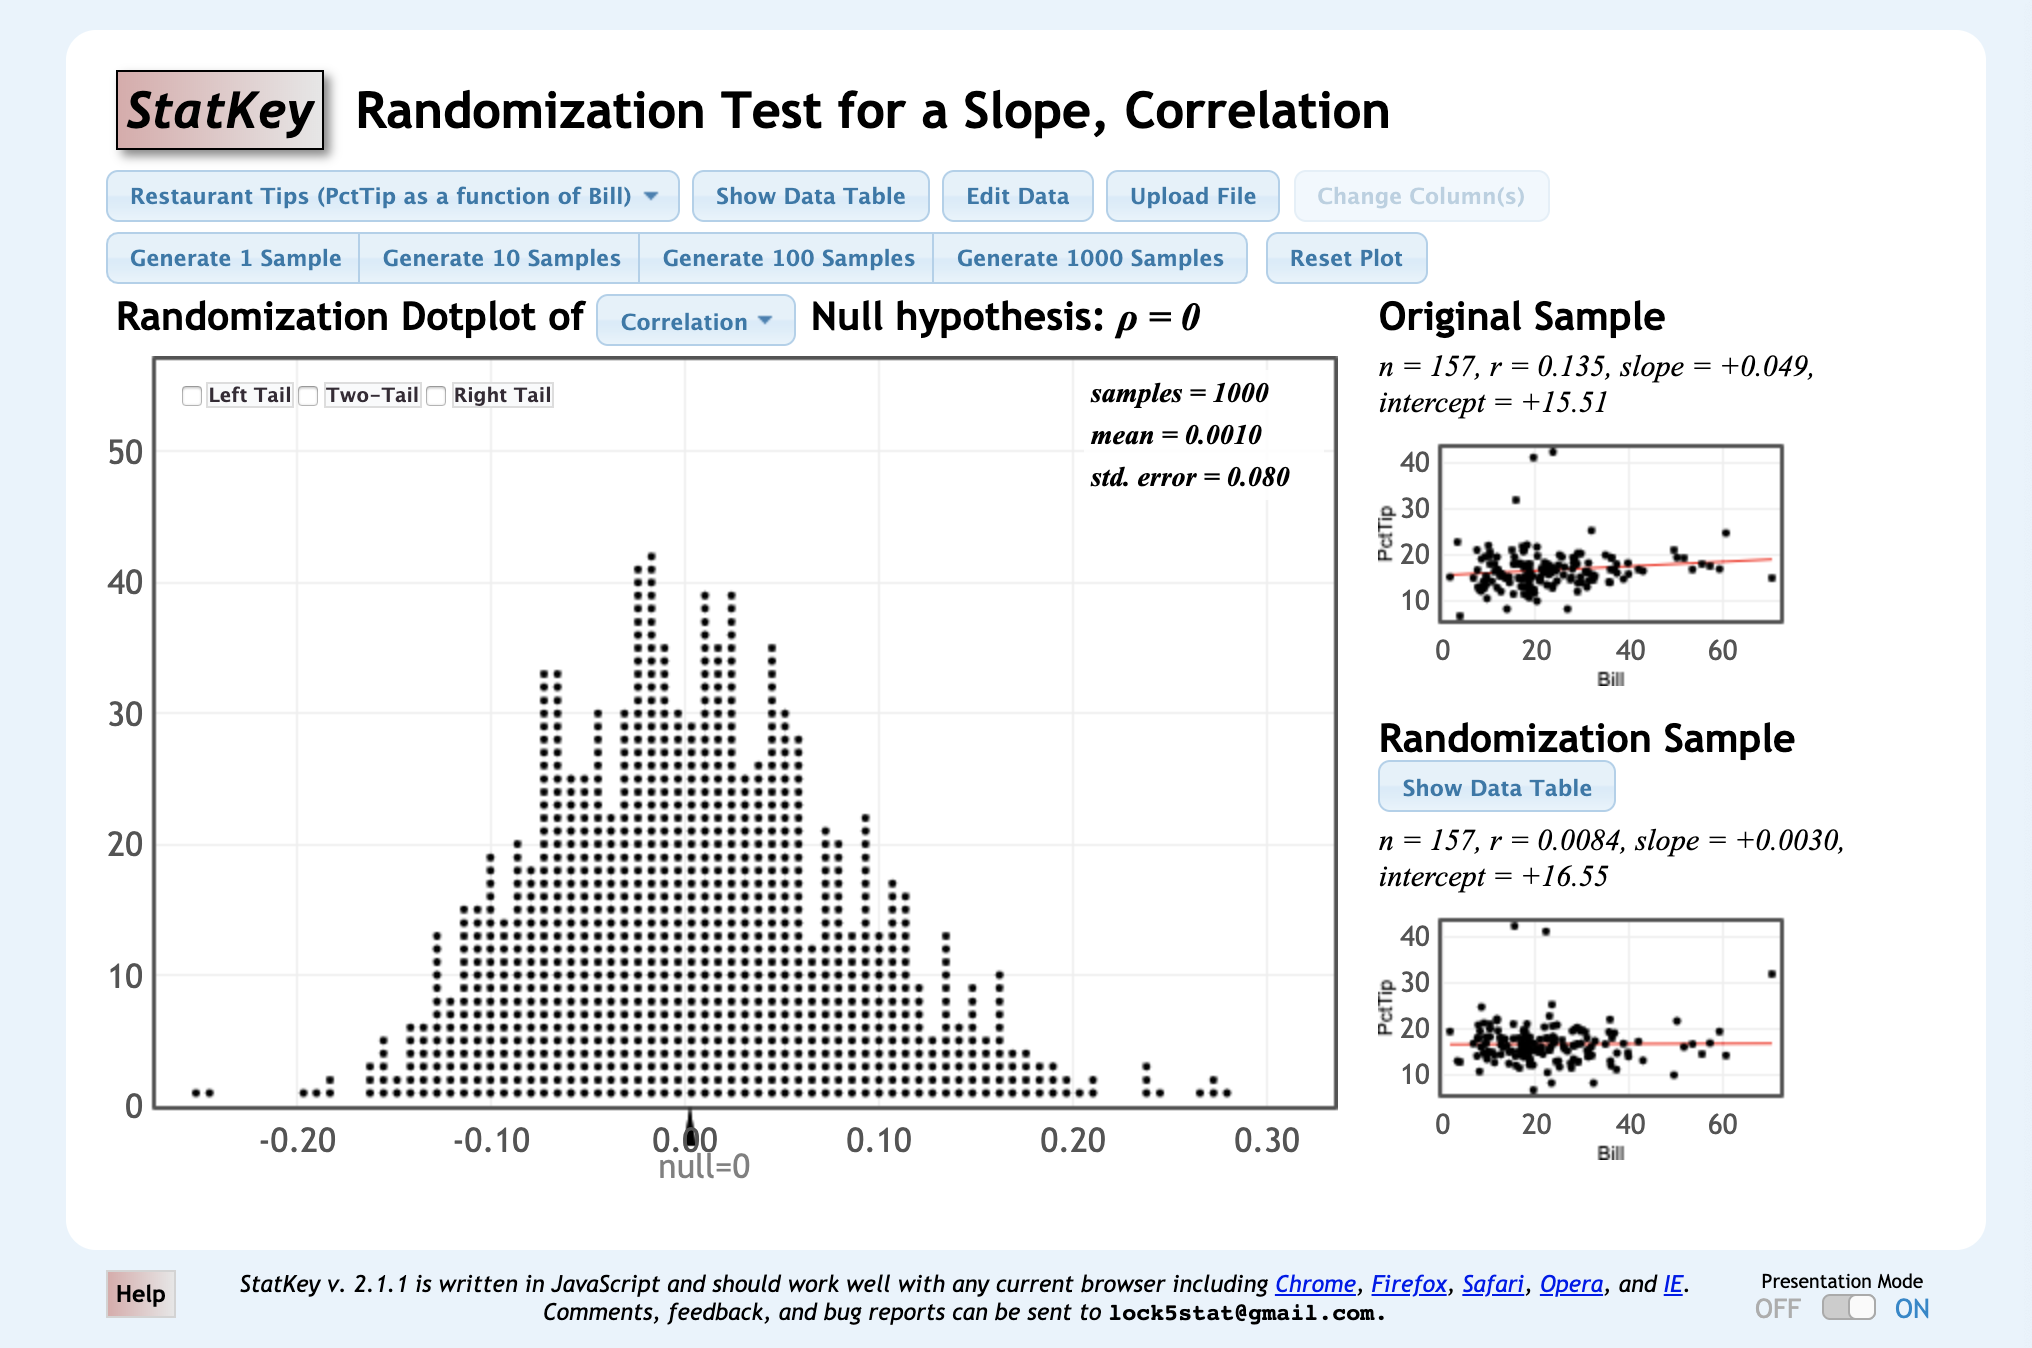
StatKey
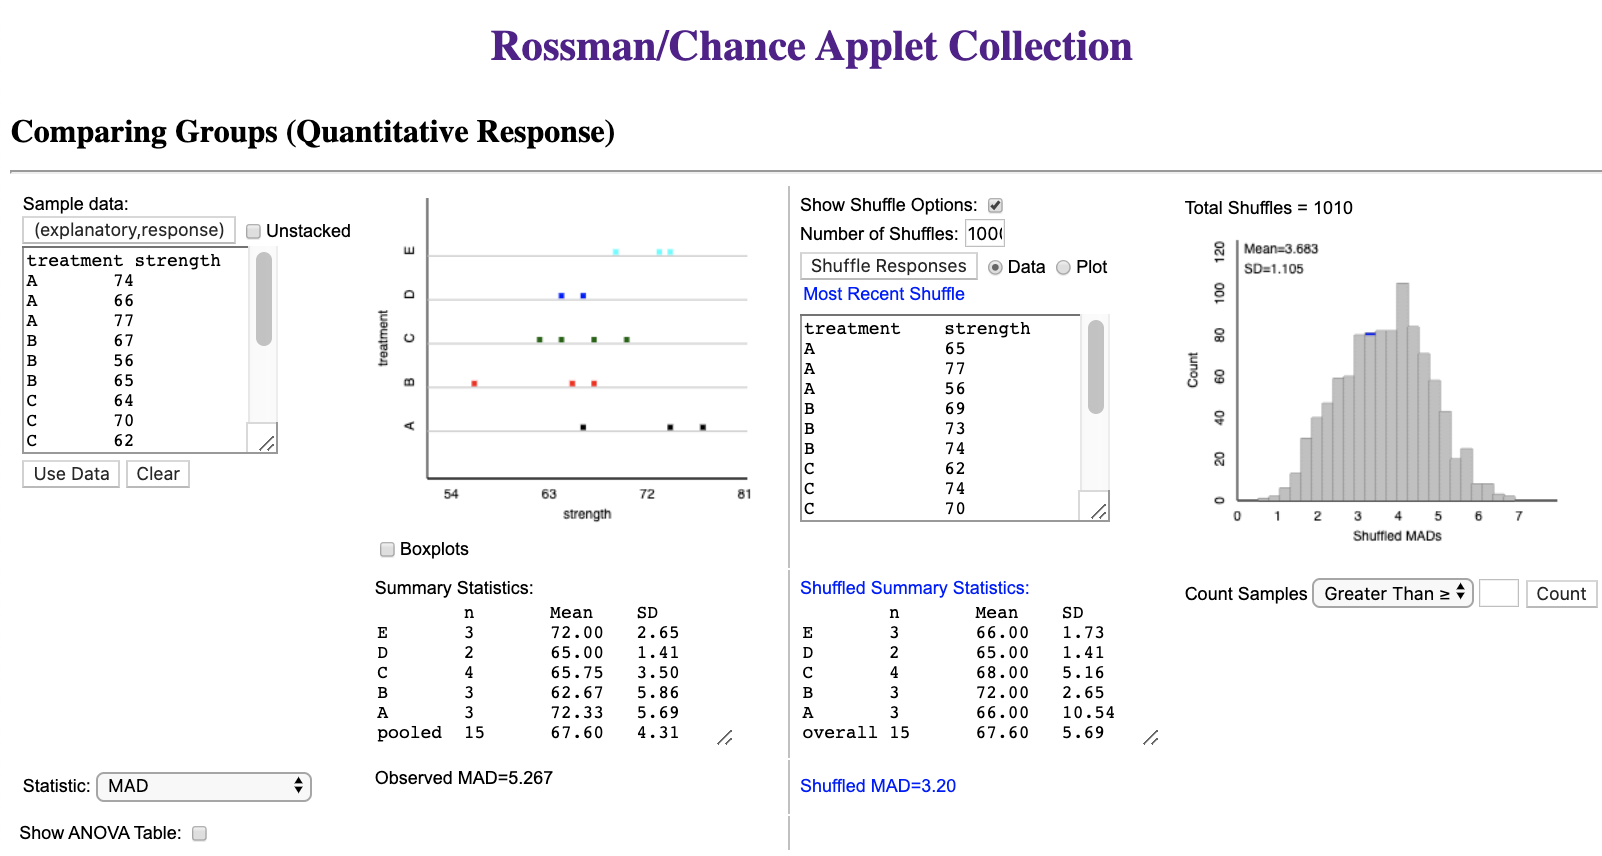
The system developed for the Lock-5 book. These emphasize resampling. The apps are written in JavaScript which makes them fast but doesn’t let them use the extensive facilities of R.
A few StatKey apps are about the display of data: here, here, and here.
Others?
Let me know.
2. Tutorials
These provide, using only a browser, a document with a narrative integrated with complete R sessions. They are not difficult to write for the experienced author of RMD documents; you can copy and customize many available examples such as provided by the online documentation For StatPREP.org I have written a set to help instructors get started with R. For instance:
- The basic vocabulary of R
- Formulas and the modeler’s tilde
- Data science graphics as opposed to Conventional graphics
Our experience at StatPREP.org is that most instructors find this an easy and pleasant way to get started with R. Nonetheless, many instructors are uncomfortable using interactive computations in front of a classroom, and so the biggest impact has been helping instructors realize that they could learn to use R in teaching if they had sufficient motivation, time, and support. In particular, support is needed to move on to the next level of computing, …
3. The blank canvas
For many years, we were limited to having students conjure up software commands essentially from scratch. For experienced or talented programmers, this is feasible. It’s made more feasible by having students adopt a good workflow that causes them to record their commands and thereby enables them incrementally to work toward a working system. The RMarkdown system in RStudio is an excellent example of this.
For using a blank canvas approach in a classroom, it’s strongly recommended that you use RStudio.cloud for your students.
- It’s free and requires only a browser. It can be used effectively on any largish display (e.g. a tablet or laptop) with a keyboard.
- You can pre-populate R projects so that your students don’t have to install packages or locate files.
- You can arrange to be able to edit your students’ projects, which can be useful for providing support and grading.
- Since it’s R, you can use the full suite of document authoring tools such as RMarkdown.
It may be that I am overreaching in saying this … You will greatly leverage your own and your students’ abilities to work reproducibly and reliably and to collaborate if you use R in conjunction with git and the GitHub cloud service. In addition to serving as a version control system, it also makes it easy to create and deploy web sites. For instance, the site you are reading now is provided via GitHub.
A nice introduction to git is provided by Jenny Bryan of the University of British Columbia and RStudio. Hicks and Irizarry describe the use of git (and many other topics) in their Guide to Teaching Data Science. See also Ben Baumer’s A data science course for undergraduates.
