Causal Inference
Correlation is causation
Suppose that two variables show a correlation and you have concluded that the data are numerous enough and the correlation strong enough that the correlation is not an artifact of sampling variation. In short, you see \(r_{xy}\) with an associated \(p < 0.00\cdots001\).
It’s commonplace in introductory statistics to emphasize that the value and sign of \(r_{xy}\) do not entitle you to draw any conclusion about a potential causal relationship between x and y. This is wrong. In fact, you are entitled to conclude that one of the following situations holds:
- \(X \Rightarrow Y\)
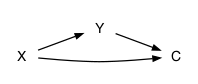
- \(X \Rightarrow C \Rightarrow Y\) and your sample is not conditioned on \(C\).
- \(X \Leftarrow Y\)
- \(X \Leftarrow D \Leftarrow Y\) and your sample is not conditioned on \(D\).
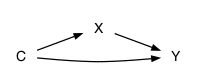
- \(X \Leftarrow W \Rightarrow Y\) and your sample is not conditioned on \(W\).
- \(X \Rightarrow Z \Leftarrow Y\) and your sample is conditioned on \(Z\).
- An elaboration that superimposes two or more of 1 through 6. Examples:
Knowing just \(r_{xy}\) does not tell you which of the possibilities is behind the correlation, but one of them must be.
Tools for inferring causation
We often know something about the world, in particular what causes what.
Example from Judea Pearl: The rooster’s crow is associated with the sun rise. Your choice:- Rooster \(\Rightarrow\) Sun
- Rooster \(\Leftarrow\) Sun
This knowledge can help us weed out some possible configurations.
Perhaps “know” should be replaced with “hypothesize,” and different people can have different hypotheses about relationships. Then there is more work to do.
Crazy example: Dr. A believes that chemotherapy agents become more effective if they have been scattered on Mars. Will NIH fund a collaboration with NASA?
We can intervene. Ideally, we take over variable X, destroying all other causal inputs to it, as in a randomized control trial.
This changes the topology of the causal network.
We can hold variables constant, either through physical intervention or by using them as covariates in models.
Physical intervention more plausible, but stratification is a feasible alternative.
Blocked and unblocked causal pathways
Consider these several simple pathways:
- \(X \Rightarrow C \Rightarrow Y\).
- Leave C free – pathway is unblocked
- Hold C constant – pathway is blocked
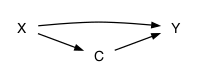
- \(X \Rightarrow C \Leftarrow Y\)
- Leave C free – pathway is blocked
- Hold C constant – pathway in unblocked.
The topology determines the correct model
“Correct” here means an unbiased presentation of the influence of X on Y

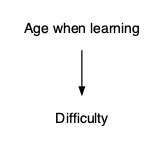
Example: Age and difficulty learning to drive
| Simple network | Other factors |
|---|---|
 |
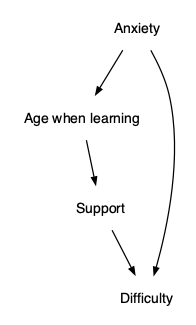 |
To study the possible relationship between age and difficulty we can intervene at support, but not so much at anxiety. Still we can stratify by anxiety.
- Intervening (or stratifying) at support blocks the causal pathway from age to difficulty.
- Failing to stratify anxiety leaves open the “back-door” pathway between age and difficulty.
Example: Intent to treat
A simple and provable way to deal with possible non-compliance or pollution.
Example: Instrumental variables
Example
Deciding what variables to control for: Child seat prices
Build some hypothetical causal networks. What results do you get when excluding/including appropriate variables