3 Regression and adjustment
computing
R
Remember to hand in your work …
At any point, you can submit your answers by collecting them and uploading them to the class site.
No answers yet collected
If the answers that have been loaded automatically are not yours, press this button before starting your work:
Note: The technical vocabulary used in statistics is sometimes informative and sometimes misleading. “Regression” is one of the misleading terms. The everyday meaning is “a return to a former or less developed state.” Put this aside completely when using “regression” in the technical sense, where it refers merely to model building.
3.1 Objectives
Gain experience with using the
model_train()andmodel_eval()functions in R to properly to build models from data and evaluate those model on new inputs.Understand R2 as a simple summary of the extent to which a model captures the relationship between explanatory variables and the response variable.
Quantify the relationship between a selected explanatory variable and the response variable using “effect size.” Understand model coefficients as a measure of effect size and be aware of the physical “units” of an effect size.
Implement “adjustment for a covariate” by building a model that includes the covariate and evaluating the model while
Understand “regression to the mean” as a consequence of mathematics, not the biological or social mechanisms originally implicated in the phenomenon.
3.2 Demonstrations
Machine-learning techniques such as CART, random forest, and support vector machines.
Graphical lesson: Why the ordering of the countries in Table tbl-mortality-rate-age is so important for seeing the patterns. Try ordering them in different ways.
3.3 Introduction
The title of this tutorial includes two words that are used in everyday speech. It’s crucial to keep in mind that the everyday meaning is substantially different from the technical statistical meaning.
- Regression
- Everyday: Return to a former or less developed state
- Technical: Statistical technique that relates a response variable to one or more explanatory variables.
- Adjustment
- Everyday: i) The process of adapting or becoming used to a new situation. ii) A small alteration or movement made to achieve a desired result.
- Technical: A mathematical technique that aims to help fairly compare things that arise in varying circumstances.
You have already seen regression models as constructed by point_plot(..., annot = "model") and model_train(...). These computational tools can also accomplish adjustment.
3.4 Adjustment
We start with a method for adjustment that is so simple that you can do it without much thinking.
Important vocabulary:
- Response variable
- the variable whose variation you want to explain.
- Explanatory variables (plural)
- those variables that you decide to use to explain the response variable. Typically, there is a single explanatory variable that is of direct interest to you, while the other explanatory variables are often not of direct interest, but play an important role in the system being studied and so shouldn’t be ignored entirely.
- Explanatory variable (singular)
- the selected variable whose influence on the response variable is the center of your interest. There can be and often is more than one explanatory variable. These additional explanatory variables
- Covariate
- an explanatory variable that is not of direct interest. “Adjustment” simulates holding covariates constant.
To adjust for a covariate mathematically, simply include it as one of the variables in the right-hand side of the tilde expression. Such adjustment is not perfect, but it is often the best we can do. The mathematical form of adjustment is designed to mimic some more intuitive adjustment mechanisms, e.g. an experiment in which the covariate is being held constant.
3.4.1 Why adjustment? Example:
As an intuitive example of adjustment, consider the various mortality rates reported in Table tbl-mortality-rate.
| Country | Death rate |
|---|---|
| Germany | 12.0 |
| Japan | 11.9 |
| France | 10.0 |
| Italy | 10.0 |
| United States | 8.5 |
| Nigeria | 8.4 |
| Panama | 5.7 |
| Uganda | 4.7 |
| Libya | 3.5 |
What accounts for the high death rates in G8 countries with excellent medical systems versus the low rates in countries from the global south? It’s tempting to associate high death rates with poor economic conditions, violent conflicts, poor nutrition, and poor medical care.
But there is another factor—which will be obvious once you hear about it—that has a massive impact on death rate: age. World wide, older people are much more likely to die. Table tbl-mortality-rate-age revisits the data from Table tbl-mortality-rate, adding in data on age.
| Country | Death rate | Median age | Age-adjusted rate |
|---|---|---|---|
| Germany | 12.0 | 46.8 | 4.7 |
| Japan | 11.9 | 49.9 | 3.9 |
| France | 10.0 | 42.6 | 3.9 |
| Italy | 10.0 | 48.4 | 3.9 |
| United States | 8.5 | 38.9 | 6.1 |
| Nigeria | 8.4 | 19.3 | 13.2 |
| Panama | 5.7 | 31.5 | 5.4 |
| Uganda | 4.7 | 16.2 | 16.0 |
| Libya | 3.5 | 26.2 | 9.6 |
The technical means of computing age-adjusted death rate is complicated and involves careful bookkeeping, but it is absolutely standard among public health professionals. With age adjustment, new patterns become evident among the countries. The G8 countries, along with Panama, have low death rates. Global south countries have high death rates, particularly in Africa. The age adjustment highlights some outliers: the US has a relatively high death rate and Panama is different from other countries in the global south.
3.5 Regression summaries
Since you already know how to use plot_model(..., annot = "model") to display a model graphically, we will focus on non-graphical summaries. These feature prominently in research literature and make it easier to reason about models.
We will work with three summaries: R2, the simplest; model coefficients; ANOVA for checking whether a new explanatory variable or new model term is really contributing to explanation of the response variable.
3.5.1 Summary 1: R2 (“R-squared”)
Recall that when modeling, we seek to “explain” or “account for” the variation in the response variable using the variation in the explanatory variables.
Let’s illustrate with our familiar model of height. The children’s height vary from one to the other. So, do the heights of the parents of the different children. The R2 summary is the variance of the model output on each of the specimens in the training data frame divided by the variance in the model output for all of the specimens.
So, R2 = 1.40 / 12.84 = 0.1090343 = 11%. In other words, the child-by-child variation in the parents’ heights explains about 11% of the variation in the adult children’s heights.
Much easier to have the software do the calculation for us:
R2 is simple to calculate. Many researchers think it is also simple to interpret, but this is not completely true. That’s one reason why there are so many other different statistics (e.g., F, adjR2, p) computed along side of R2.
For example, here’s an easy-sounding question: Is the 11% value for R2 in height ~ mother + father large or small? The largest theoretically possible value for R2 is 100%. 11% seems small compared to that. And look at the variation in the residuals shown in Active R chunk lst-3-R2: It’s practically as large as the variance in height, meaning that predictions based on height ~ mother + father are hardly better than a guess.
In a different context, however, an R2 of 11% might be huge. For instance, if I could model tomorrow’s stock prices with an R^2% of 11%, I would quickly become one of the richest people in the world.
Note for those who studied statistics in high school: R2 is, for simple regression—that is, only one explanatory variable—the same as the square of the “correlation coefficient from elementary statistics. But, as will become increasingly evident, we need a statistic that’s relevant to two or more explanatory variables.
3.5.2 Summary 2: Model coefficients
Another way to summarize a model is to look at the “conversion factor” from each explanatory variable to the response variable. These conversion factors have a technical name: model coefficients. Display them with the conf_interval() model summarizing function:
Direct your attention to the .coef column. The model coefficients provide a formula for the model output in terms of the explanatory variables. We won’t worry about such formulas here, preferring another way of thinking about the coefficients.
Statisticians are very careful about the distinction between association and causation. Association is about the data, causation is about the real-world mechanism that produces the data. The coefficient 0.28 for mother means that each inch of additional mother’s height is associated with 0.28 inches of height gain in the adult child. Similarly, the father coefficient, 0.38, says that taller fathers are associated with taller children at a rate of 0.38 inches of child’s height per inch of father’s height.
It’s been a tradition in statistics, well evidenced in introductory statistics textbooks, to use almost exclusively the word association. (There is one traditional exception: data from controlled experiments with random assignment to the explanatory variable.) But what are you to conclude from an association, particularly if you’re interested in explaining or exploiting real-world mechanisms?
I prefer to refer to coefficients differently. For instance, the coefficient of 0.28 can be described like this: for every additional inch of mother’s height, children are taller by 0.28 inches (on average). To avoid criticism by statistics teachers, I’ll consider that all such statements come with a qualification: “The data are consistent with an imagined mechanism where for every additional [unit change in input], the [output] changes by ….”
This leaves an important question for those interested in applying statistics: Is there good reason to believe that the imagined mechanism is similar to the real-world mechanism. We will postpone that question until Tutorial 5.
3.5.3 Summary 3: ANOVA
Modelers frequently encounter situtations where they have to decide whether there is any point in adding a new explanatory variable (or retaining an existing explanatory variable) in the model. A model summary called “Analysis of Variance” (ANOVA) provides helpful information to assist the decision-maker. For simplicity, we will refer to such summaries as “F tests.”
Suppose, for instance, that a Galton obsessive wanted to know if family size influences children’s height. (An imagined mechanism: larger families face larger competition almong children for food.)
We will build two models, one with and one without the nkids explanatory variable:
Model 2 has a higher R2 than model 1, but is the increase sufficiently large to conclude that nkids has something to say about height. ANOVA produces a statistic called “F,” labelled simply “statistic” in the output from Active R chunk lst-3-F-2
The larger F is, the more the data provide evidence that nkids really contributes. Whether a particular value of F is large or small depends on the context. (This is similar to R2, which is indeed closely related to F.) Conventionally, F is converted to another scale, based on the idea that the additional variable might possibly be just random and not connected to the response variable. This scale, called a p-value is conventionally (and not fully justifiably) compared in size to 0.05. If the p-value is less than 0.05, the indication is that nkids has something to say. Reasoning about what that something is will be more effective with the tools to be introduced in Tutorial 5.
3.6 Summary of software
These are the functions we are using in constructing a regression model and interpreting it.
model_train()builds a model from data based on a selected response variable and explanatory variables.model_eval()finds the model output for one or more sets of inputs.R2()calculates the R2 summary.conf_interval()displays the model coefficients. We use the model coefficients to estimate effect sizes.anova_summary()compares two models.
These tools will be used when constructing and interpreting informative models in Blocks 4 and 5 of QR2.
3.7 Regression to the mean
Consider the situation faced by Francis Galton. In the 1880s and 1890s he was inventing new mathematical techniques for summarizing data, particularly data that might reveal the action of genetic inheritance of biological traits, a field newly in vogue in scientific circles. Knowledge we take for granted—about DNA, chromosomes, genes—mostly nonexistent. In an important sense, Galton’s mathematical techniques were at the cutting edge.
Height is a biological trait that is especially easy to measure. Galton collected extensive data on the heights of parents and their children. (Our Galton data frame comes from Galton’s lab notebooks.) In working with the height data, Galton noticed a surprising pattern. Very tall or very short fathers tended to have sons who were not so very tall or short; the sons’ heights were closer to average.
Figure fig-height-regression shows the sons’ versus fathers’ heights for the fathers who are in the shortest 10% and the tallest 10%.
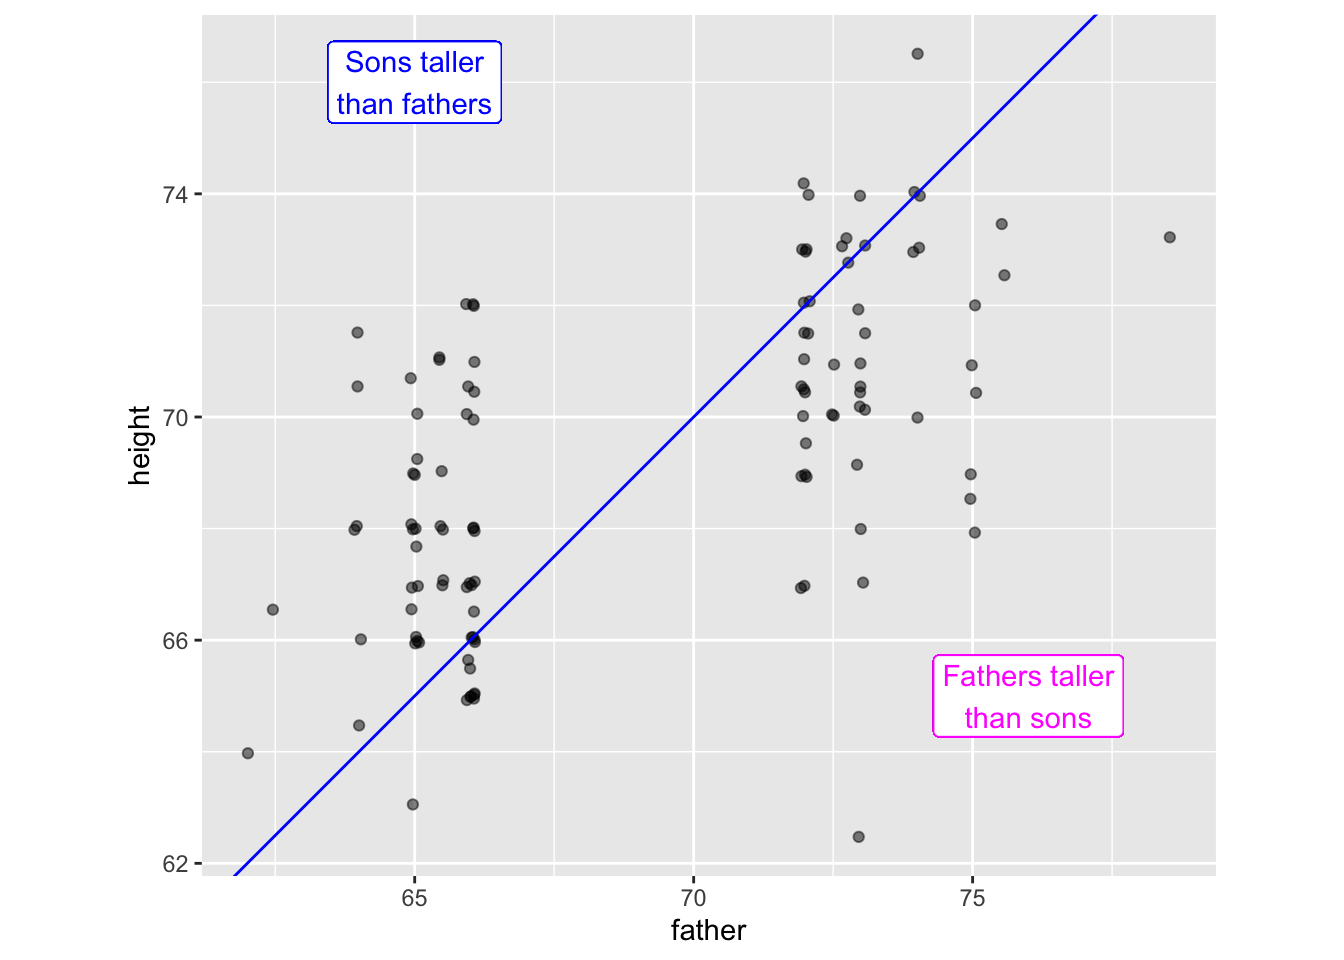
The blue line in Figure fig-height-regression goes through points where the father and son have the same height. Above this line, the son is taller than the father. Below the line, the son is shorter than the father.
The shortest fathers have sons who are mainly taller than the father. The tallest fathers have sons who are mainly shorter than the father. Galton called this phenomenon “Regression to mediocrity.” The sons are more mediocre in stature than the fathers. Galton originally thought that this was a genetic phenomenon uncovered by the new statistical method. The method came to be called “regression analysis” with “regression” showing the families’ “return to a former or less developed state.”
Remarkably, such regression was found in all sorts of data, for instance the profits made by commercial firms in successive years or decades. It didn’t take long for statisticians to realize that such regression is seen even in entirely random numbers, the result of the play of randomness. Even so, the term “regression analysis” persists.
No answers yet collected