Activities C: Tutorial 3
Remember to hand in your work …
At any point, you can submit your answers by collecting them and uploading them to the class site.
No answers yet collected
If the answers that have been loaded automatically are not yours, press this button before starting your work:
Activity C.1 The Hill_racing data frame contains winning results for a cross-country running event that is popular in Scotland: Scottish Hill Racing. The time variable gives the winning time in seconds, while distance gives the length of the race (in km). The twist: there is also a climb, given in meters.
Active R chunk C.1 is set up to calculate how fast the winners go, averaging across all the events.
- Since
timeis in seconds, anddistancein km, what are the units of the coefficient?
3-scottish-racing-units
The races are of varying distances, 1.1 to 43 km. It’s to be expected that a person running 43 km will run each kilometer slower than a person running a 2K race. The coefficient (381) tells how much more time in seconds it would take to run an additional kilometer.
- According to the model, how much time does it take to 10-km race?
3-scottish-racing-10k
We can also look at the running time as a function of climb, as in Active R chunk C.2.
- Since time is measured in seconds and climb is measured in meters, what are the units of the coefficient 5.65 in the summary of
time ~ climb?
3-scottish-racing-climb-units
- The longest climb in
Hill_racingis 2400 meters, about a mile-and-a-half gain in altitude. According to Active R chunk C.2, how long would it take to run the 2400 meter-climb race?
3-scottish-racing-10-climb
To be fair to the race competitors, we should recognize that each even is a combination of a climb and a distance. Active R chunk C.3 includes both distance and climb as explanatory variables.
The summary of time ~ distance + climb says it would take 254 seconds (according to the model) to run a km without any altitude gain, and 2.6 seconds to climb a meter without any distance (which is unphysical). Compare these coefficients to the ones from time ~ distance and time ~ climb and explain in everyday terms why the time ~ distance + climb model shows the runners being both faster in distance and faster in climb.
Activity C.2 In these tutorials, we compute a summary of a single variable using the summarize() wrangling command. To illustrate, let’s find the average height of the (full-grown) children in Galton:
We use another technology, model_train(), to look at the relationship between (or among) variables. For instance:
The explanatory variable sex in Active R chunk C.5 is categorical with two levels: F and M. In such a situation, there is only one coefficient corresponding to the explanatory variable. The coefficient print-out calls this sexM, which means that it refers to the males. So, where did the females go?
To investigate, Active R chunk C.6 uses summarize() with a .by= argument to calculate means separately for males and females. (You’ll have to replace ___variable___ with the name of an actual variable.)
- What does the
(Intercept)coefficient from the modelheight ~ sextell us?
galton-mean-q1
- What does the
sexMcoefficient tell us?
galton-mean-q2
- Whenever R trains a model with a categorical explanatory variable, one of the levels is selected as the reference level. (By default, the level that is first alphabetically is used as the reference level.)
What is the reference level used in the height ~ sex model trained on the Galton data.
galton-mean-q3
Demonstrate that the coefficient from y ~ 1 is the mean of y. In the case of a binary variable, the coefficient is the proportion of the category assigned level 1.
Activity C.3 Always fun to work with the penguin data! Active R chunk C.7 computes a simple model of penguin bill length:
- What is the mean bill length for Chinstrap penguins? (Bill length is measured in cm.)
3-penguins-species-1
- As always, R selects a reference level for the categorical explanatory variable
species. Here’s a summary of height.byspecies:
Which species is being used as the reference level in the model specified by bill_length ~ species?
3-penguins-species-2
Activity C.4 A “Null model” is a model without any explanatory variables. For instance, a Null model for penguin bill length has the formula bill_length ~ 1.
Penguins |>
  model_train(bill_length ~ 1) |>
  conf_interval()
# A tibble: 1 × 4
term .lwr .coef .upr
<chr> <dbl> <dbl> <dbl>
1 (Intercept) 43.4 44.0 44.6What does the (Intercept) coefficient from this Null model tell us?
3-null-model-1
Activity C.5 Here are two models of the Hill_racing data. Both have time as the response variable and have distance and climb as the explanatory variables. One of them involves an interaction between climb and distance, the other does not.
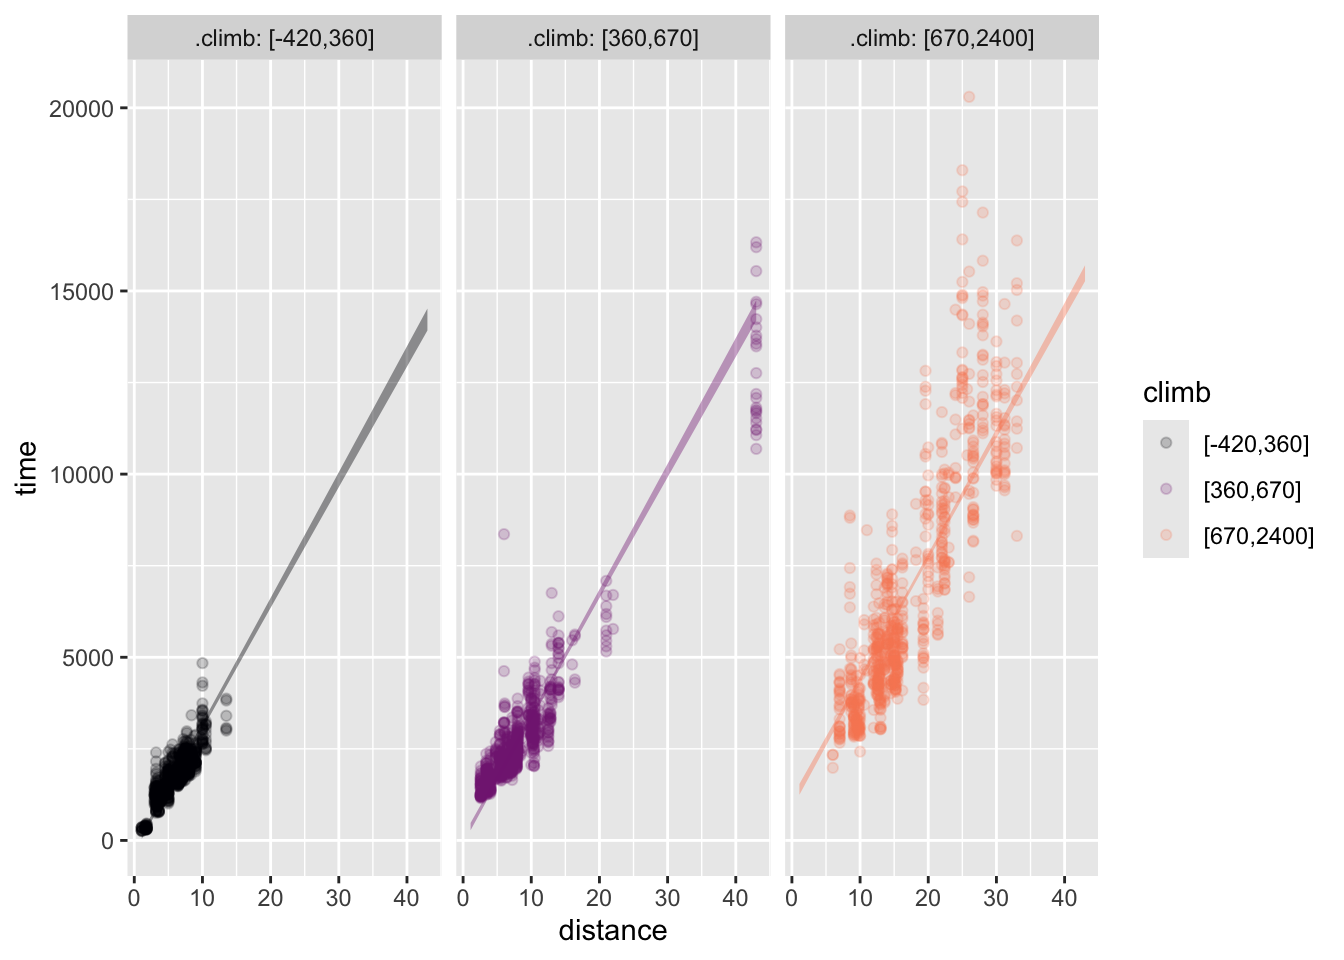
Hill_racing data.
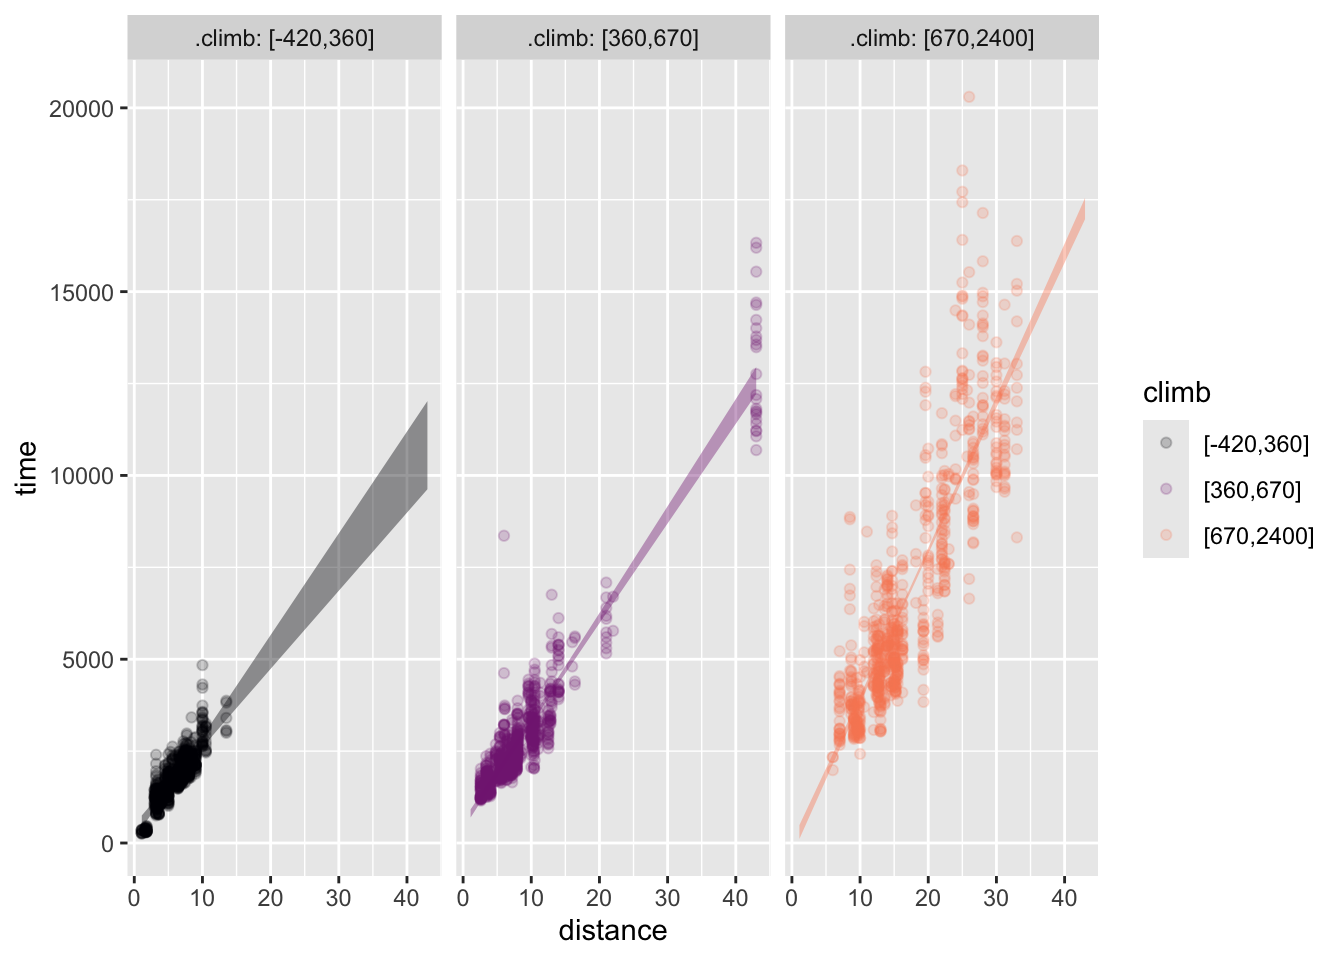
Hill_racing data.
First, identify which model, (a) or (b), involves the interaction term. Then, say whether the interaction model gives longer or shorter race times for the high-climb events. Finally, explain in everyday terms why the interaction model gives a more plausible account of how fast the runners go in low-climb versus high-climb races.
No answers yet collected