Hunting for clutter
A useful guiding principle: simplicity?
Entia non sunt multiplicanda praeter necessitatem.—William of Occam (1285-1346)
Alles muß so einfach wie möglich sein. Aber nicht einfacher.—Albert Einstein
This exercise is to help us identify statistical entities that have multiplied beyond necessity; things that aren’t as simple as they can be.
Example: Measuring variation
Variation itself is nature’s only irreducible essence. Variation is the hard reality, not a set of imperfect measures for a central tendency. Means and medians are the abstractions. —– Stephen Jay Gould (1941- 2002), paleontologist and historian of science.
Jessica Utts, in a 2003 TAS paper, “selected seven topics that I have found to be commonly misunderstood by citizens, including the journalists who present statistical studies to the public. In fact researchers themselves, who present their results in journals and at the scientific meetings from which the journalists cull their stories, misunderstand many of these topics.”—“What educated citizens should know about statistics and probability” The American Statistician 57(2)
7. Understanding that variability is natural, and that “normal” is not the same as “average.”
Many texts introduce the measurement of variation by talking about spread, introducing the standard deviation, and “explaining” the sd with reference to a normal distribution.
No data, but lots of stuff!
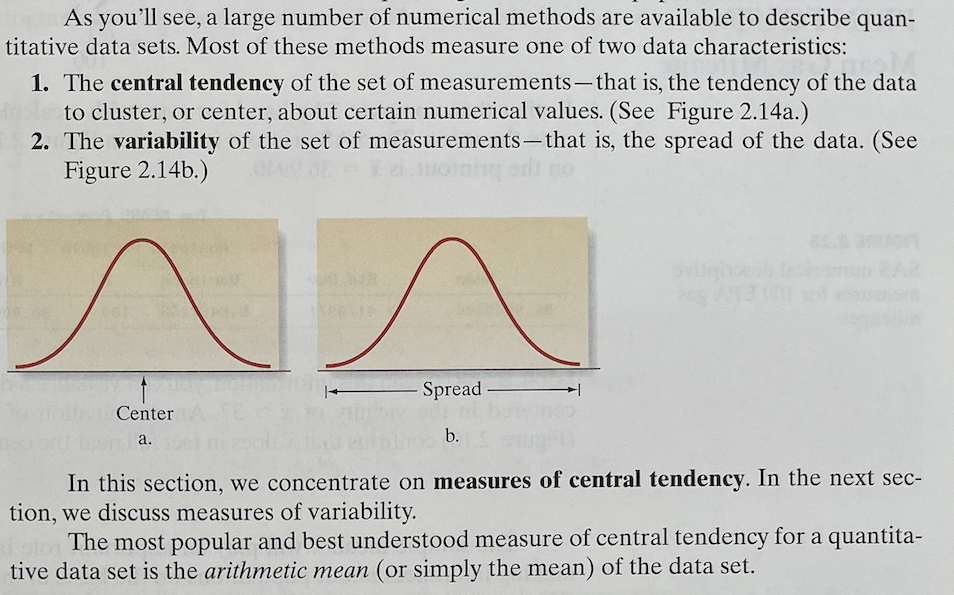
- “large number of numerical methods”
- vertical axis that’s representing … what?
- “cluster” about “certain numerical values.”
- uses horizontal space as metaphor, reinforcing this with “center” and “spread”
- “quantitative data sets.” Is this something different from a numerical variable.
 Even more stuff …
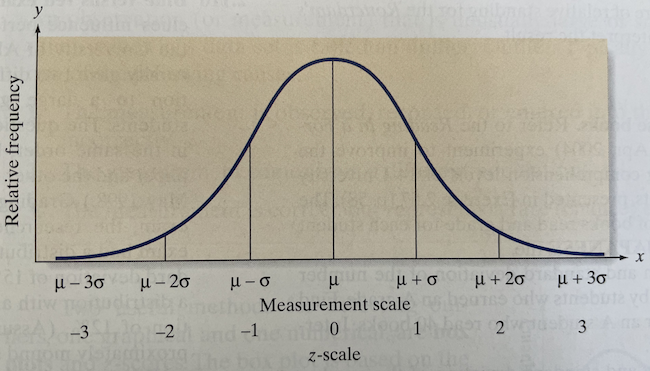
- Now axis is labeled “relative frequency,” but no units are given.
- Two horizontal scales, \(x\) and \(z\)
- Greek letters!
- Are the vertical lines data? No. Do we need to split up the normal distribution this way?
More stuff …
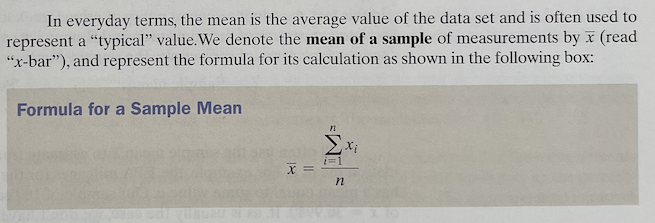
- average vs mean
- summation notation and indexing \(x_i\)
- the bar means one thing on the right side of the equation, something else on the left side.
… and we haven’t yet gotten to variation!
We’ll end up with a formula for the standard deviation:
\[\sqrt{\frac{1}{n-1} \sum_i (x_i - \bar{x})^2}\] - the mean, x-bar, must be calculated first - then square. (Why not absolute value?) - A big square root (needed to undo the squaring, which maybe we don’t need in the first place) - an average, but strangely with \(n-1\), not \(n\). - will we go further and explain that the population variance involves \(\frac{1}{n}\) but the sample variance uses \(n-1\). (And when do we calculate the standard deviation of a population? And is a population the same thing as a variable? Is a sample the same thing as a variable?)
And do we end up suggesting that “center” and “spread” are tied together?
Your turn: Looking for clutter
Ideas for topics:
- Variation (the subject of our example)
- Hypothesis testing zoo
- The regression table
- Non-parametric tests
- Graphical modes
- … your group’s own choice.
Choose an intro stats topic area and discuss with your group:
What vocabulary, mathematical concepts or notation, statistical theory, or graphical modes are commonly used in teaching that topic.
How you can streamline the presentation to use a minimum of vocabulary, math, theory, or graphical modes.
If you want to include something because you suspect that some other group will be using it for their topic, make a special note that this is the case so that we can see whether or not another group actually needs it.
Question 1: What statistic do you teach for measuring the amount of “variation” in a “variable”?
Question 2: Which is more fundamental: standard deviation or variance?
Invent an introduction to the variance without reference to the mean and that keeps to a minimum the introduction of new vocabulary, new graphical modes, etc.
- Extra points if you can describe the calculation as a simple algorithm, without formulas like \[\frac{1}{n} \left[\sum_i x_i^2 - \frac{1}{n}\left(\sum_i x_i\right)^{\!\!2}\ \right] .\]