Math 300Z In-class activity
Intervals by eye
In this activity, you are given some point plots of data: y vs x. Your job is to
- sketch in an appropriate model fitted (by eye) to the data.
- add a prediction band showing for each value of x what is the prediction interval
- transform the prediction band into a confidence band.
TIPS:
- The fitted model will be a line or curve, or in the case of Model 3, two lines.
- The bounds of the prediction band will be more-or-less parallel to the fitted model, but should include roughly 95% of the \(n\) points in the plot.
- The confidence band is narrower than the prediction band by a factor of \(1/\sqrt{n}\).
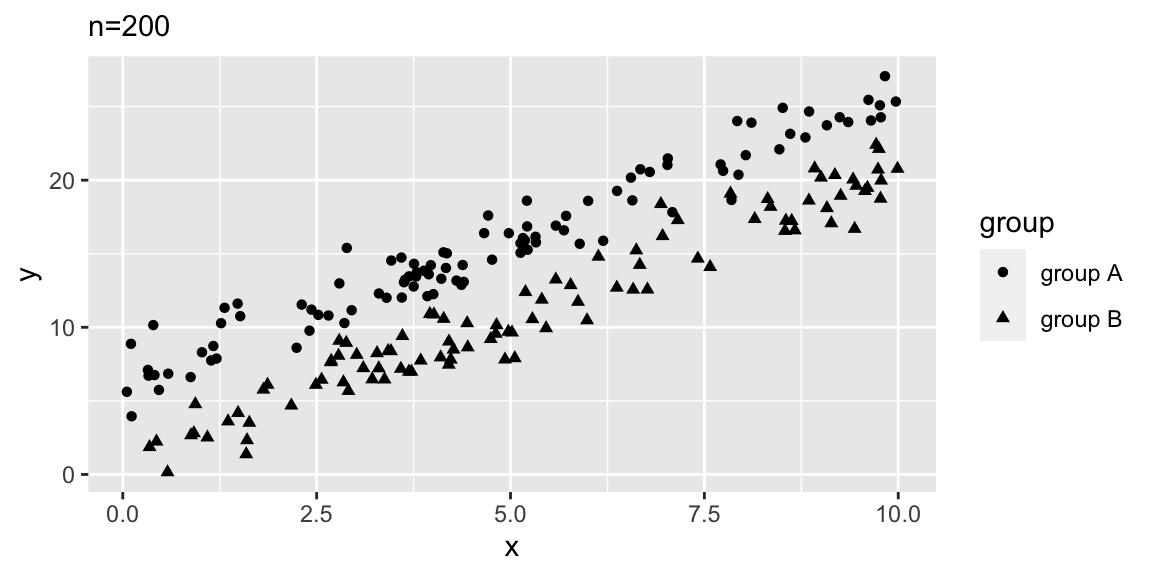
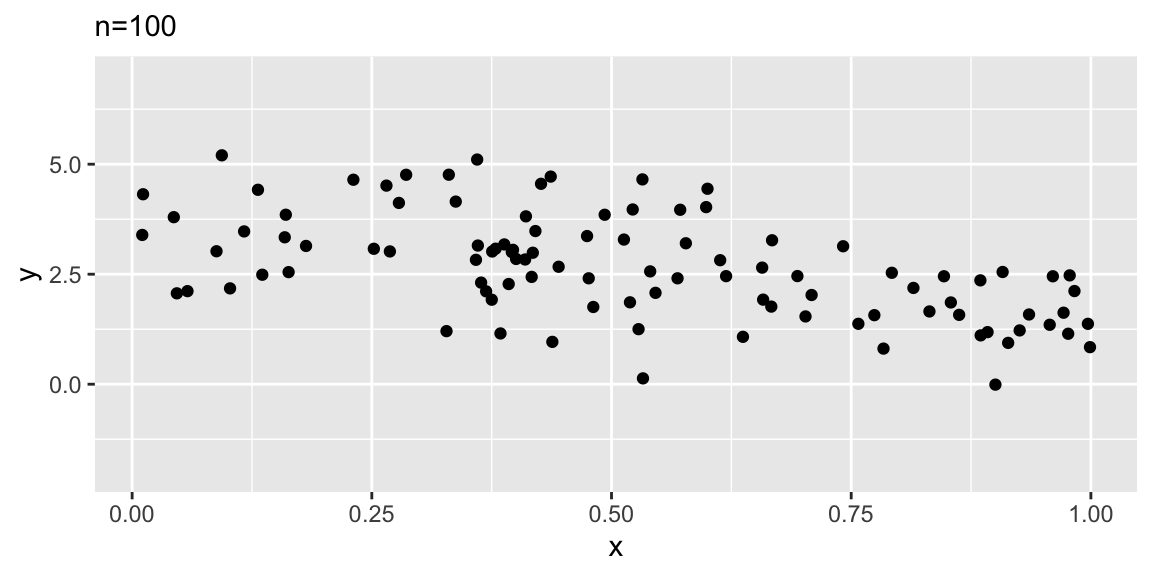
Model 1: A straight-line model y ~ x
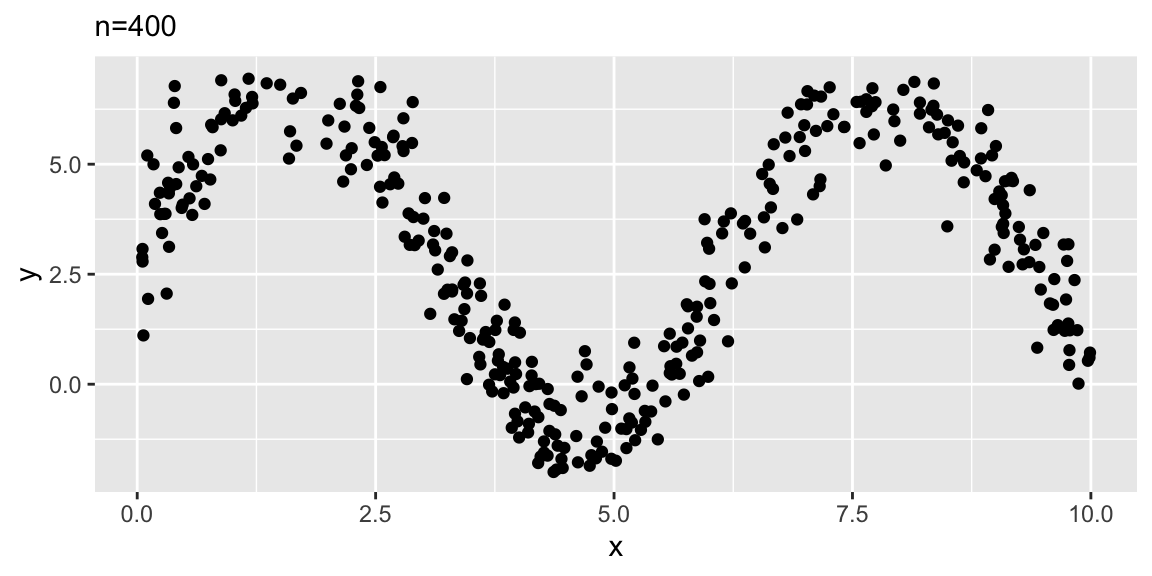
Model 2: A sine-wave model, y ~ sin(x)
Model 3: A function of two variables, y ~ x + group