Convenience function for adding labels to point_plot or others without needing the ggplot2 + pipe.
Source:R/pointplot.R
add_plot_labels.RdConvenience function for adding labels to point_plot or others without needing the ggplot2 + pipe.
Arguments
- P
A ggplot2 object, for instance as made with
point_plot()ormodel_plot()- color
Name for color legend (works for
point_plot())- ...
Label items (e.g.
x = "hello") as in ggplot2::labs
Examples
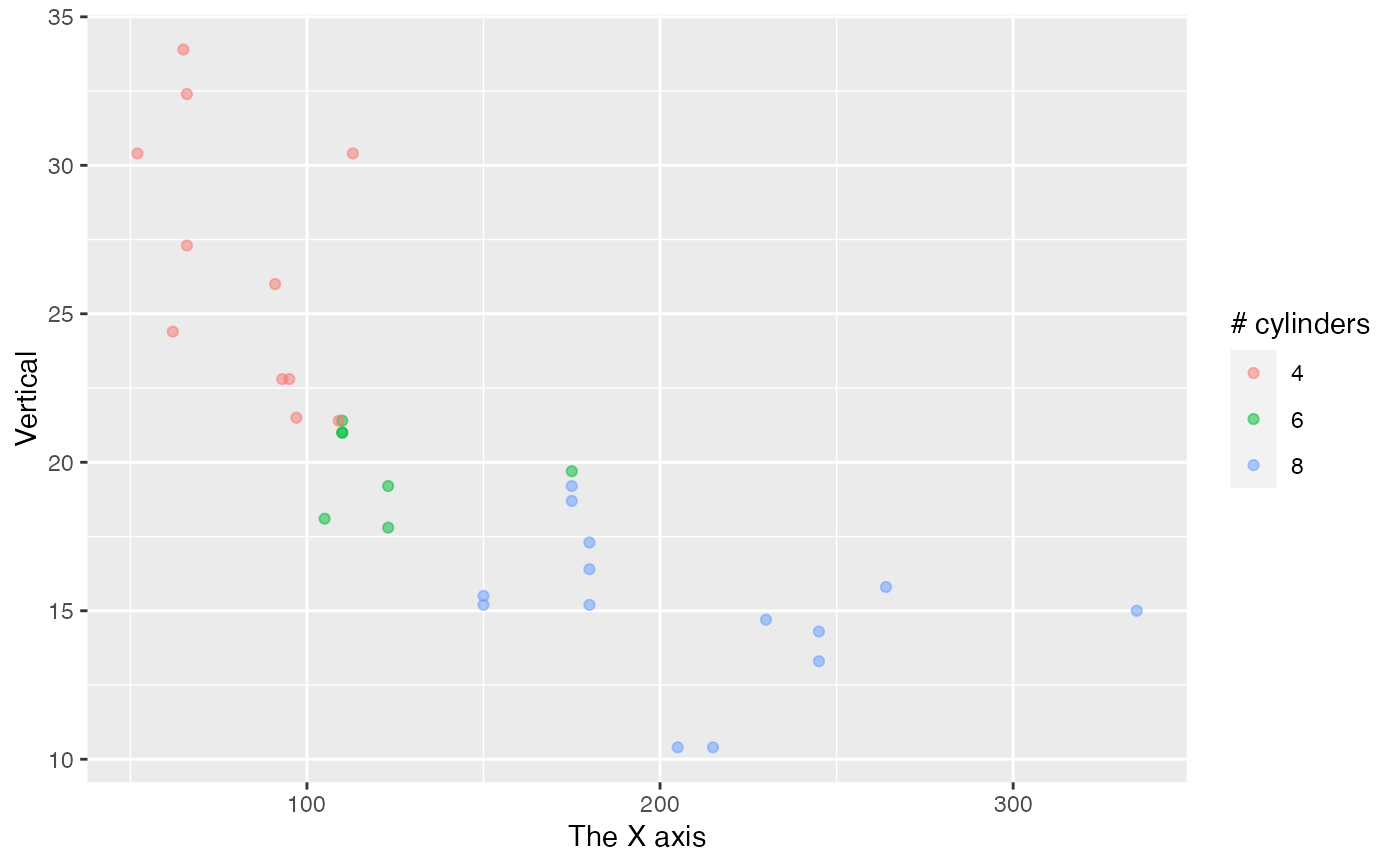
mtcars |> point_plot(mpg ~ hp + cyl) |>
  add_plot_labels(x = "The X axis", y = "Vertical", color = "# cylinders")
#> Scale for colour is already present.
#> Adding another scale for colour, which will replace the existing scale.