Warning: `geom_abline()`: Ignoring `mapping` because `slope` and/or `intercept` were
provided.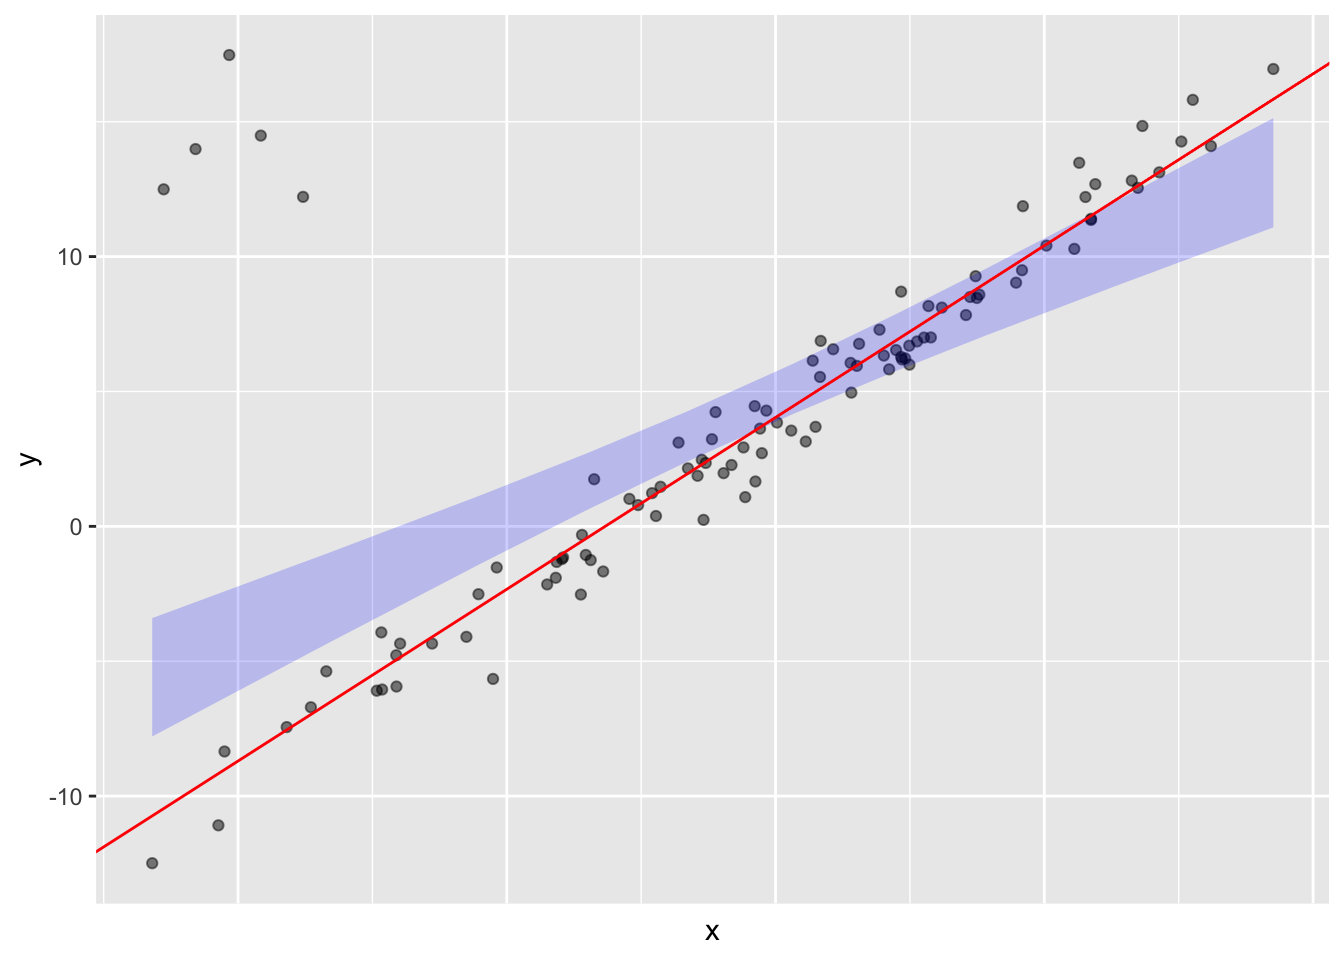
Consider a data frame with two variables, x and y. Here are annotated point plots of the individual variables.

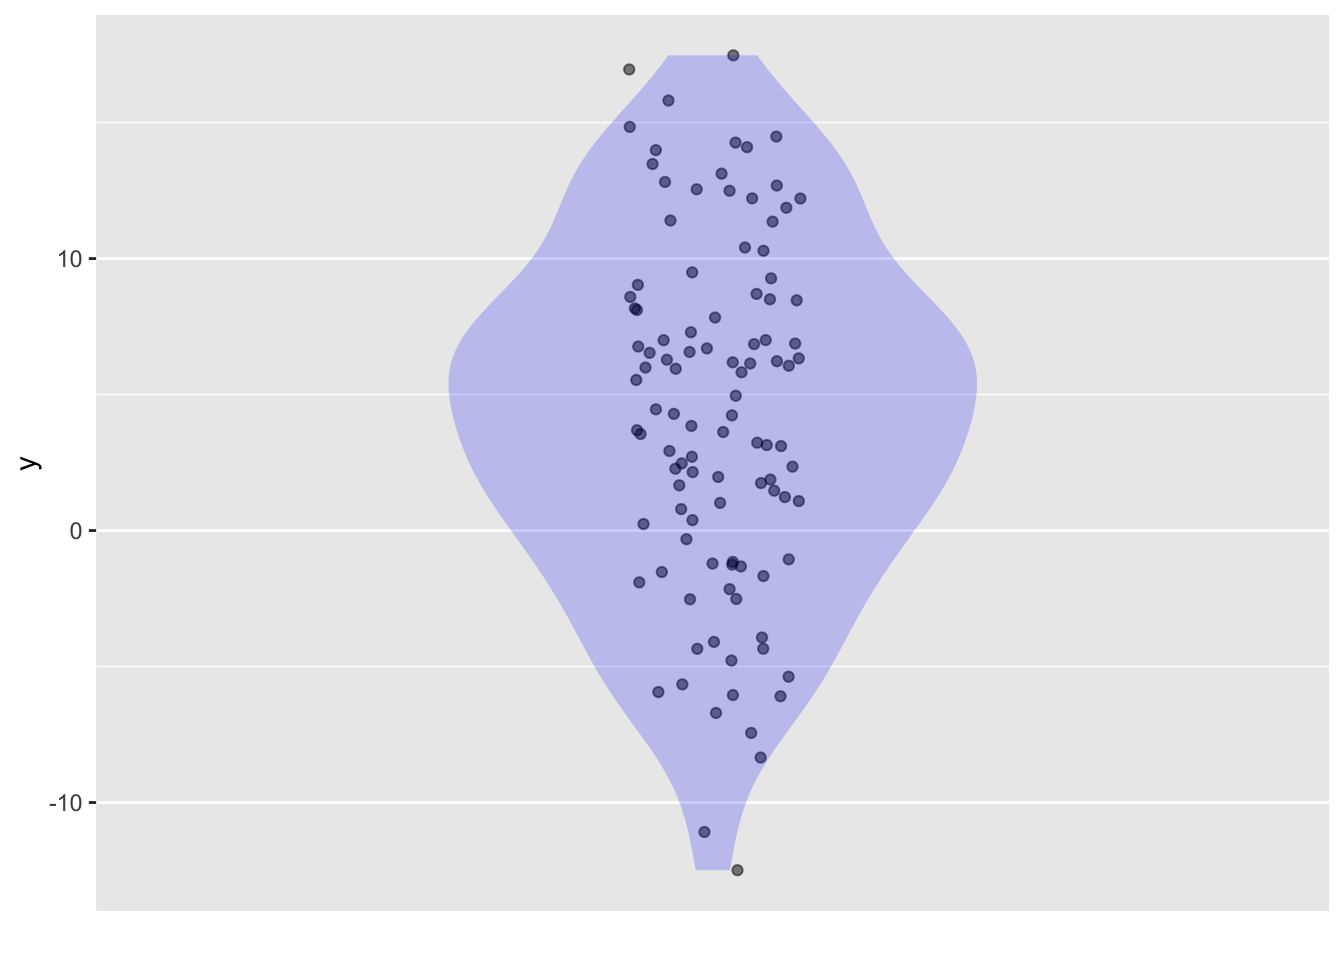
x or y? Explain what you see in the graphs that account for your answer.Even when individual variables do not show outliers, there can be outliers from the relationship between the two variables, as in the following graph.
model_train(y ~ x) and model_eval().)Warning: `geom_abline()`: Ignoring `mapping` because `slope` and/or `intercept` were
provided.
The blue band in the following plot shows the model, but it does not exactly align with the diagonal cloud of points running from bottom-left to upper-right. The left end of the band is pulled upward by the outliers; the right end is forced downwards so that the middle of the band can be near the middle of the data. Excluding the outliers from the data used for fitting would address the matter. But we have more sophisticated methods that both identify outliers and make the model robust to them. The red line shows the model fitted by MASS::rlm(), where rlm stands for “robust linear modeling.”