| Year | Exports | Imports |
|---|---|---|
| 1700 | 180 | 460 |
| 1701 | 170 | 480 |
| 1702 | 160 | 490 |
| 1703 | 150 | 500 |
| 1704 | 145 | 510 |
| 1705 | 140 | 525 |
| 1706 | 135 | 550 |
| 1707 | 125 | 565 |
| 1708 | 120 | 580 |
| 1709 | 110 | 590 |
| 1710 | 105 | 625 |
| 1711 | 105 | 650 |
| 1712 | 100 | 680 |
| 1713 | 100 | 710 |
| 1714 | 100 | 725 |
| 1715 | 100 | 755 |
| 1716 | 100 | 795 |
| 1717 | 100 | 825 |
| 1718 | 110 | 860 |
| 1719 | 120 | 880 |
| 1720 | 130 | 900 |
| 1721 | 140 | 925 |
| 1722 | 145 | 940 |
| 1723 | 150 | 955 |
| 1724 | 145 | 960 |
| 1725 | 135 | 965 |
| 1726 | 130 | 970 |
| 1727 | 130 | 975 |
| 1728 | 145 | 980 |
| 1729 | 160 | 980 |
| 1730 | 170 | 975 |
| 1731 | 170 | 980 |
| 1732 | 170 | 980 |
| 1733 | 175 | 982 |
| 1734 | 205 | 985 |
| 1735 | 225 | 987 |
| 1736 | 260 | 985 |
| 1737 | 285 | 982 |
| 1738 | 310 | 980 |
| 1739 | 345 | 980 |
| 1740 | 370 | 980 |
| 1741 | 390 | 978 |
| 1742 | 410 | 975 |
| 1743 | 440 | 975 |
| 1744 | 465 | 978 |
| 1745 | 500 | 980 |
| 1746 | 520 | 980 |
| 1747 | 550 | 960 |
| 1748 | 585 | 960 |
| 1749 | 650 | 955 |
| 1750 | 700 | 940 |
| 1751 | 725 | 910 |
| 1752 | 750 | 880 |
| 1753 | 780 | 850 |
| 1754 | 805 | 835 |
| 1755 | 810 | 830 |
| 1756 | 810 | 830 |
| 1757 | 815 | 850 |
| 1758 | 825 | 890 |
| 1759 | 850 | 945 |
| 1760 | 875 | 1000 |
| 1761 | 910 | 1100 |
| 1762 | 950 | 1300 |
| 1763 | 1010 | 1400 |
| 1764 | 1120 | 1470 |
| 1765 | 1330 | 1500 |
| 1766 | 1380 | 1510 |
| 1767 | 1395 | 1515 |
| 1768 | 1380 | 1520 |
| 1769 | 1350 | 1525 |
| 1770 | 1330 | 1530 |
| 1771 | 1285 | 1530 |
| 1772 | 1250 | 1535 |
| 1773 | 1190 | 1535 |
| 1774 | 1050 | 1535 |
| 1775 | 925 | 1535 |
| 1776 | 880 | 1540 |
| 1777 | 860 | 1545 |
| 1778 | 845 | 1545 |
| 1779 | 840 | 1550 |
| 1780 | 840 | 1550 |
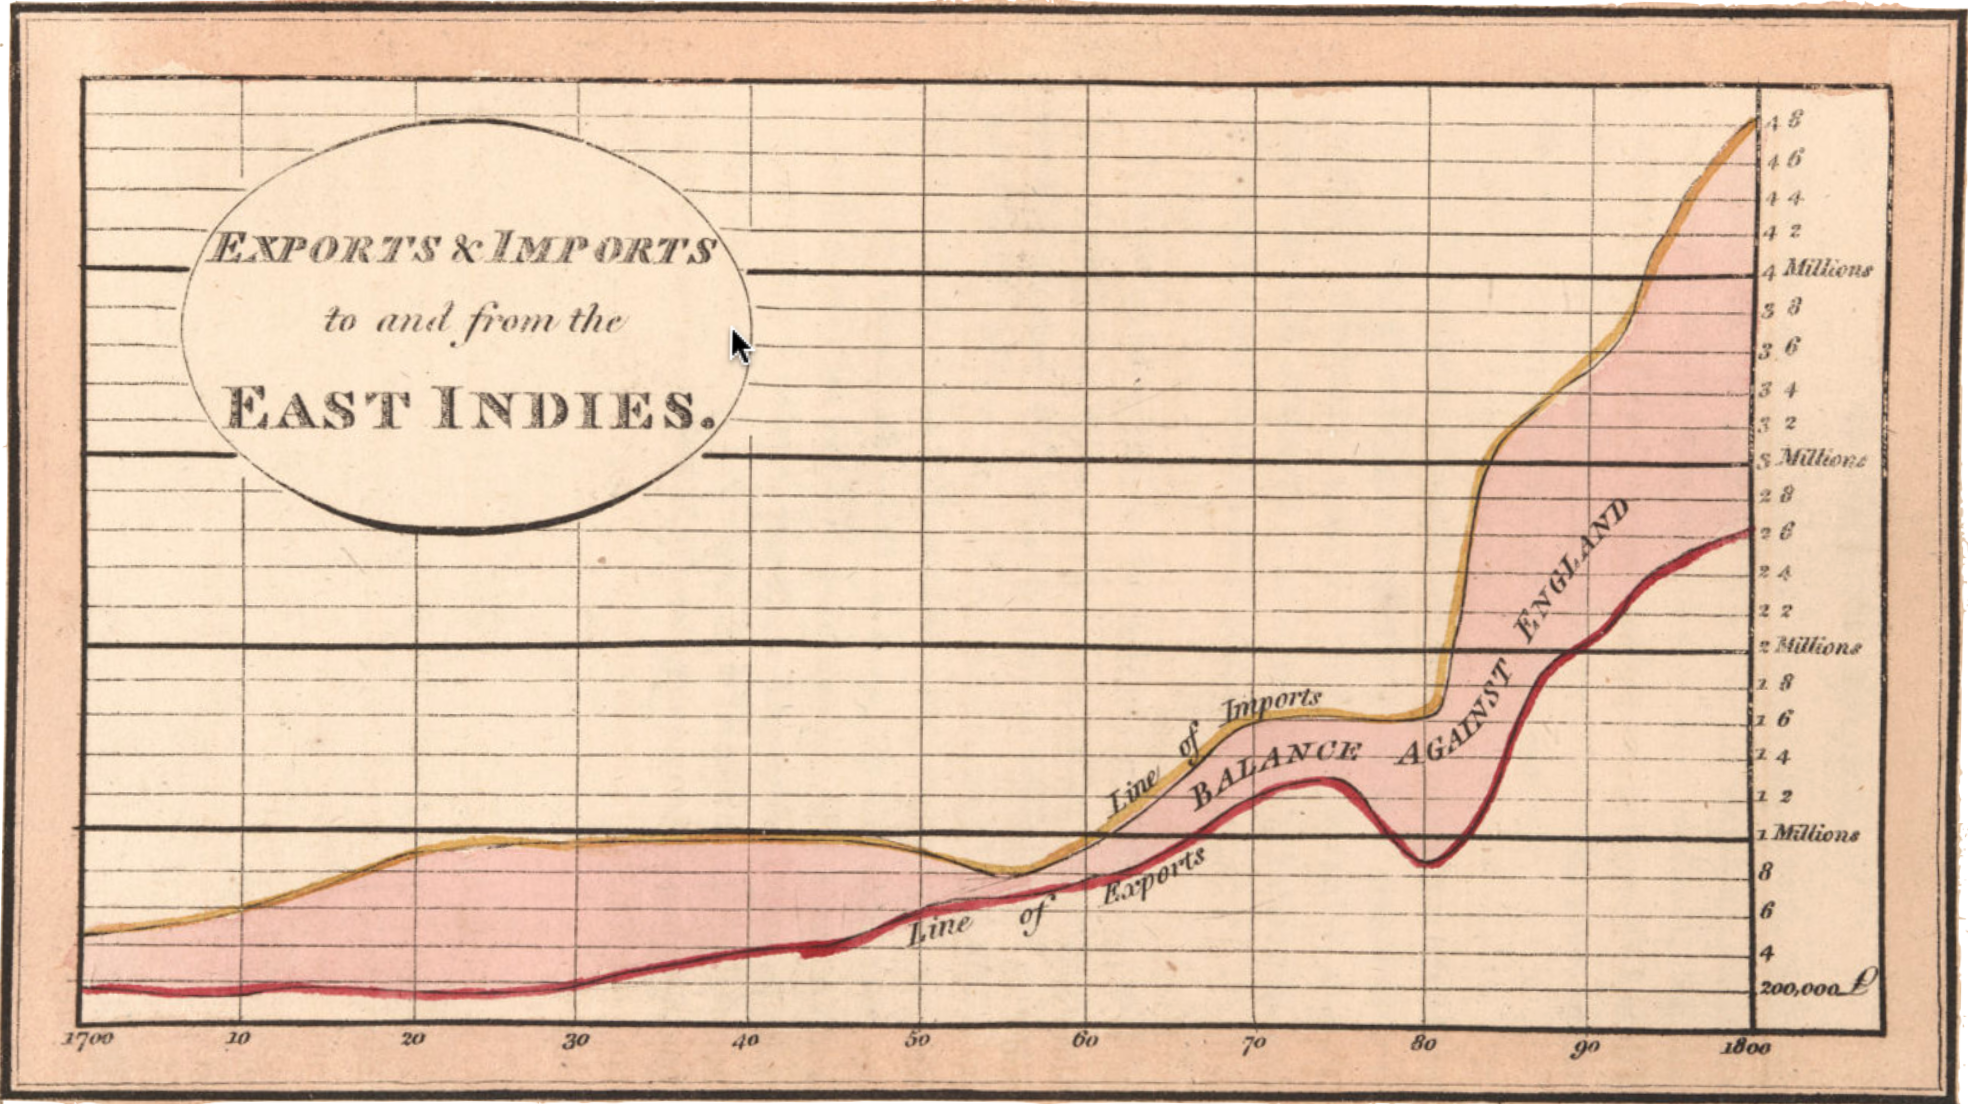
William Playfair (1759-1823) is credited as the inventor of novel graphical forms in which data values are presented graphically, rather than as numbers or text. To illustrate, consider the data from the 1700s (Table 1) that Playfair turned into a picture.
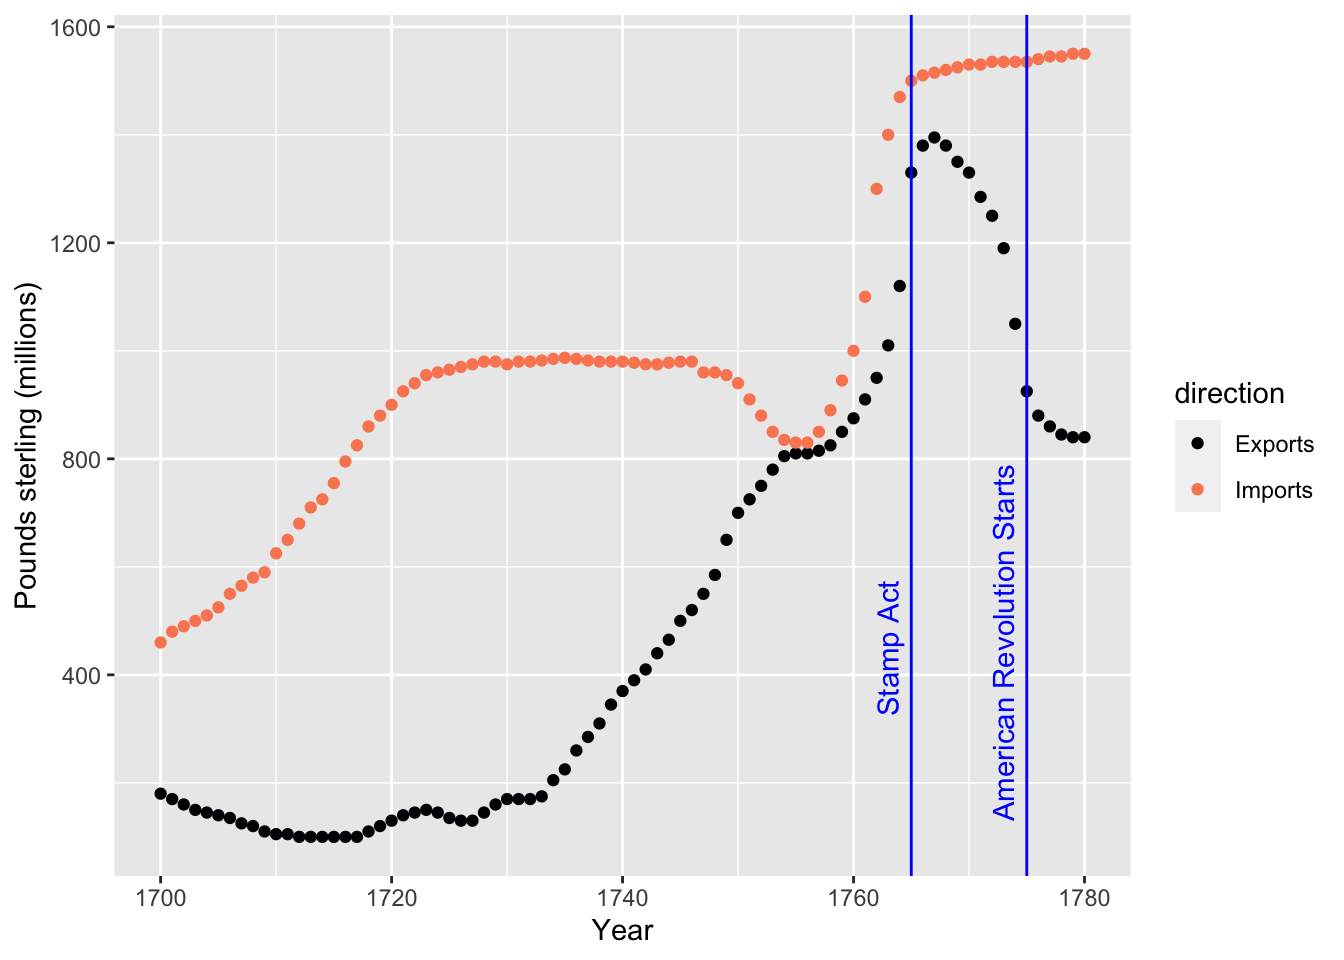
Playfair’s innovation, as in Figure 1, was successful because it was powerful. The pattern that is latent in the data frame becomes visually obvious to the human viewer. The picture shows not only the trade values each year but also the trends across the decades.
The American revolution is marked out by the graph; you can see the steady fall in English exports from 1775-1780, corresponding to the American boycott during the revolution. Exports pick up again after the revolution, but English imports increase even more rapidly, leading to a steady expanding trade deficit by 1800. The historical consequences of this deficit are profound with continuing implications.
The historically minded reader should note that the the growing English trade deficit in 1800 had important historical consequences that are still playing out in the 2020s.
“The roots of the Opium War (or First China War) lay in a trade dispute between the British and the Chinese Qing Dynasty. By the start of the 19th century, the trade in Chinese goods such as tea, silks and porcelain was extremely lucrative for British merchants. The problem was that the Chinese would not buy British products in return. They would only sell their goods in exchange for silver, and as a result large amounts of silver were leaving Britain.
“In order to stop this, the East India Company and other British merchants began to smuggle Indian opium into China illegally, for which they demanded payment in silver. This was then used to buy tea and other goods. By 1839, opium sales to China paid for the entire tea trade.”—National Army Museum
By 1839, facing millions of Chinese citizens addicted to opium, the Chinese government began to successfully intervene to stop the smuggling, much as the US and other countries still do to curtail illegal drug trade. The English government found this unacceptable and went to war with China. With less advanced military technology, that war was a disaster for the Chinese and led to the impoverishment of the country and the forced transfer of territory—such as Hong Kong—to England. In the 1930s, a greatly weakened China fell victim to Japanese imperialism, then communist revolution. Only in the 1990s did China start to overcome extreme poverty. In the 2000s, the Chinese are still seeking to restore the economic pre-eminance they held before the eruption of the English opium trade.
DRAFT
Annother historical relationship is revealed by adding some annotations to a point plot of the data, as in Figure 2. The Stamp Act was essentially a tax imposed on the American colonies, prompted by economic difficulties in England. The American Revolution led to a large economic burden on England to fund the war.